
Data Storytelling for Business
Craft presentations that combine effective visuals with a compelling narrative, weaving your data into a story that captures attention and inspires decision-makers to act.
Download BrochureNext course date June 2, 2026
Delivery modules 1d in-person or 6h online
Class size Up to 25 learners
Who’s it for Everyone
Course overview
|
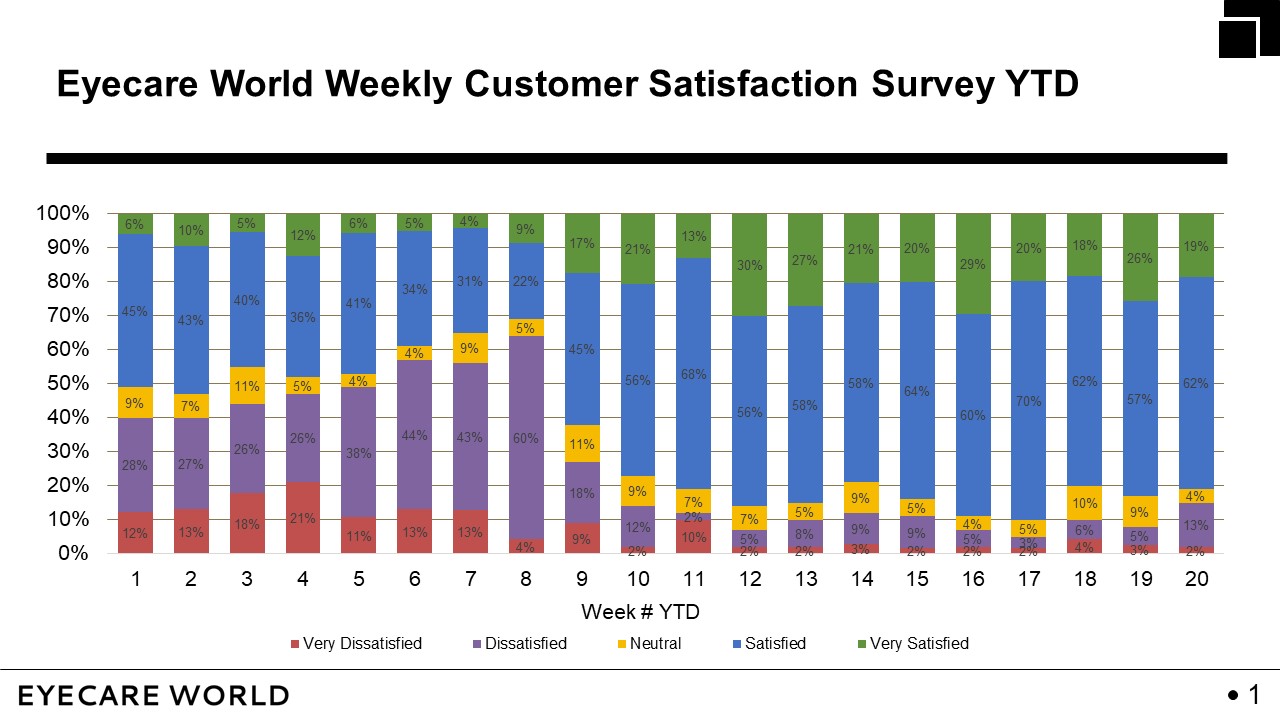
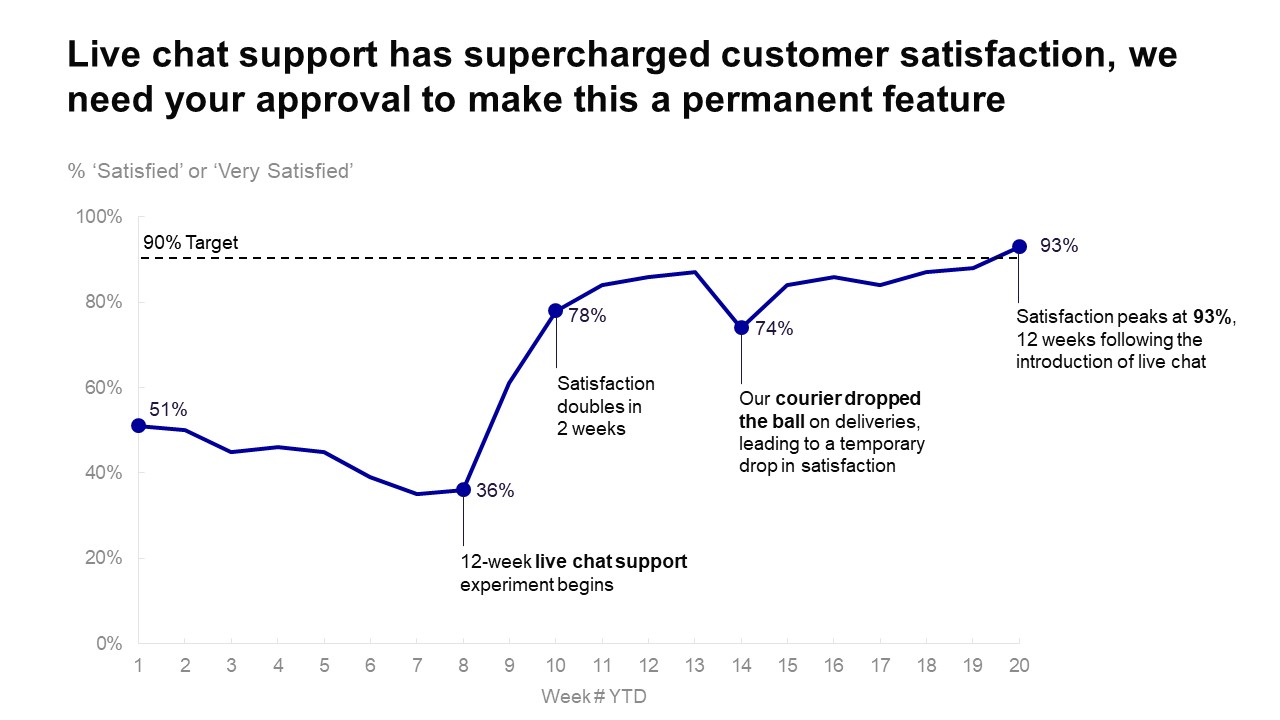
Storytelling has been ingrained in human culture for millennia. Our brains are hardwired to respond to stories, making them a powerful tool for communication and persuasion. Data Storytelling for Business equips learners with the ability to integrate impactful data visualizations into a unified narrative, culminating in a key message that supports a data-informed decision. The course underscores the value of developing data stories that resonate with the audience, fostering stakeholder engagement and facilitating strategic decision making. This course provides participants with a practical five-step framework for crafting compelling data stories, which learners can apply immediately after class. Get in touch |
Definewho your audience is and identify the key takeaway they need to know. Drafta compelling storyline that logically and persuasively guides your audience towards your key takeaway. Displaythe data using visualizations that effectively convey your message. Declutteryour visuals by eliminating unnecessary elements that distract from your core message. Directyour audience’s attention to the most critical aspects of your data story using principles from psychology. |
Businesses that have taken this course


How this workshop can help
We upskill people in the core data and communication skills required to make an impact in organizations, transforming professionals into influential contributors.
From data analytics to data story
By the end of the course, learners will be able to produce both single slide and multi-slide data stories that focus stakeholder attention and use data to support a key takeaway.


What they’re saying

"This was the best investment of time I have made all year. If you want to be able to deliver an impactful message centered around data, you need the knowledge in this course. Clear & concise materials provided actionable information on every page. To top it off, the instructor was a complete rock star!"

"This data storytelling for business course will certainly add value to my work. I will never look at data presentations the same way again. I am looking forward to applying my learning right away! This was simply transforming and will make creating presentations more exciting!"

"This training completely changed the way I think about presentations. It brought a world of knowledge, in terms of design and storytelling. It was three days of engaging and interesting learning that I will 100% use in my daily work. I highly recommend it to whomever has to do presentations to different stakeholders."
Course delivery options
In-Person Team Training
Gather a group of 10-25 learners for a private in-person class with a StoryIQ Master Facilitator. Delivered at a venue of your choosing, our private classes are customizable to your team’s needs.
Get startedCourse duration
- One day in-person
We also offer 1-2 hour seminars that cover the most essential concepts.
Course options
Bring your own report to class
Participants will be given the opportunity to enhance their own reports in class, with these reports becoming the basis for class discussion and feedback from a StoryIQ facilitator. This popular class option keeps learning relevant and leads to tangible improvements to the discussed reports.
Post-training consultation sessions
After completing the course, learners will be assigned a post-training homework activity that involves refining one of their own reports. Four weeks after the class, a StoryIQ facilitator will meet with participants in small groups of 3-5 learners to assess progress and provide constructive feedback.
Department-wide or organization-wide rollout
We provide special additional support for leaders and L&D professionals who are responsible for fostering data storytelling skills more widely throughout their organization. Talk to us about your specific needs.
In-Person Public Training
Join a group of up to 25 learners in a public in-person class with a StoryIQ Master Facilitator. Learn alongside attendees from various industries, in a class described by learners as ‘instantly applicable’.
View upcoming eventsCourse duration
- One day in-person
Course options
Bring your own report to class
All public class attendees are given the optional opportunity to bring along their own report to class, with this report becoming the basis for class discussion and feedback from a StoryIQ facilitator.
Virtual Team Training
Gather a group of 10-25 learners for a private online class with a StoryIQ Master Facilitator. Delivered live via Zoom or similar, our private virtual classes are customizable to your team’s needs.
Get startedCourse duration
- Two 3-hour virtual sessions held over two days
We also offer 1-2 hour virtual seminars that cover the most essential concepts.
Course options
Bring your own report to class
Participants will be given the opportunity to enhance their own reports in class, with these reports becoming the basis for class discussion and feedback from a StoryIQ facilitator. This popular class option keeps learning relevant and leads to tangible improvements to the discussed reports.
Post-training consultation sessions
After completing the course, learners will be assigned a post-training homework activity that involves refining one of their own reports. Four weeks after the class, a StoryIQ facilitator will meet with participants in small groups of 3-5 learners to assess progress and provide constructive feedback.
Department-wide or organization-wide rollout
We provide special additional support for leaders and L&D professionals who are responsible for fostering data storytelling skills more widely throughout their organization. Talk to us about your specific needs.
Virtual Public Training
Join a group of up to 25 learners in a public online class with a StoryIQ Master Facilitator. Learn alongside attendees from various industries, in a session described as ‘instantly applicable’.
View upcoming eventsCourse duration
- Two 3-hour virtual sessions held over two days
Course options
Bring your own report to class
All public class attendees are given the optional opportunity to bring along their own report to class, with this report becoming the basis for class discussion and feedback from a StoryIQ facilitator.
Self-Paced
Take control of your learning with our on-demand Data Storytelling for Business course.
Designed for busy professionals who value flexibility, our self-paced class enables you to learn at your own pace, on your own schedule.
Course duration
- 3 hours
Course options
Post-training virtual consultation sessions
After completing the course, learners will be assigned a post-training homework activity that involves refining one of their own reports. Four weeks after the class, a StoryIQ facilitator will meet with participants in small groups of 3-5 learners to assess progress and provide constructive feedback.
Department-wide or organization-wide rollout
We provide special additional support for leaders and L&D professionals who are responsible for fostering data storytelling skills more widely throughout their organization. Talk to us about incorporating our self-paced data storytelling course into your LMS system.
Upcoming public events
Custom workshops
We specialize in private classes for teams. Get in touch and we can discuss your specific needs.
Custom workshop experiences
Unlocking insights with L'Oréal
StoryIQ helped cultivate data storytelling skills with L'Oréal, the world's largest cosmetics company.
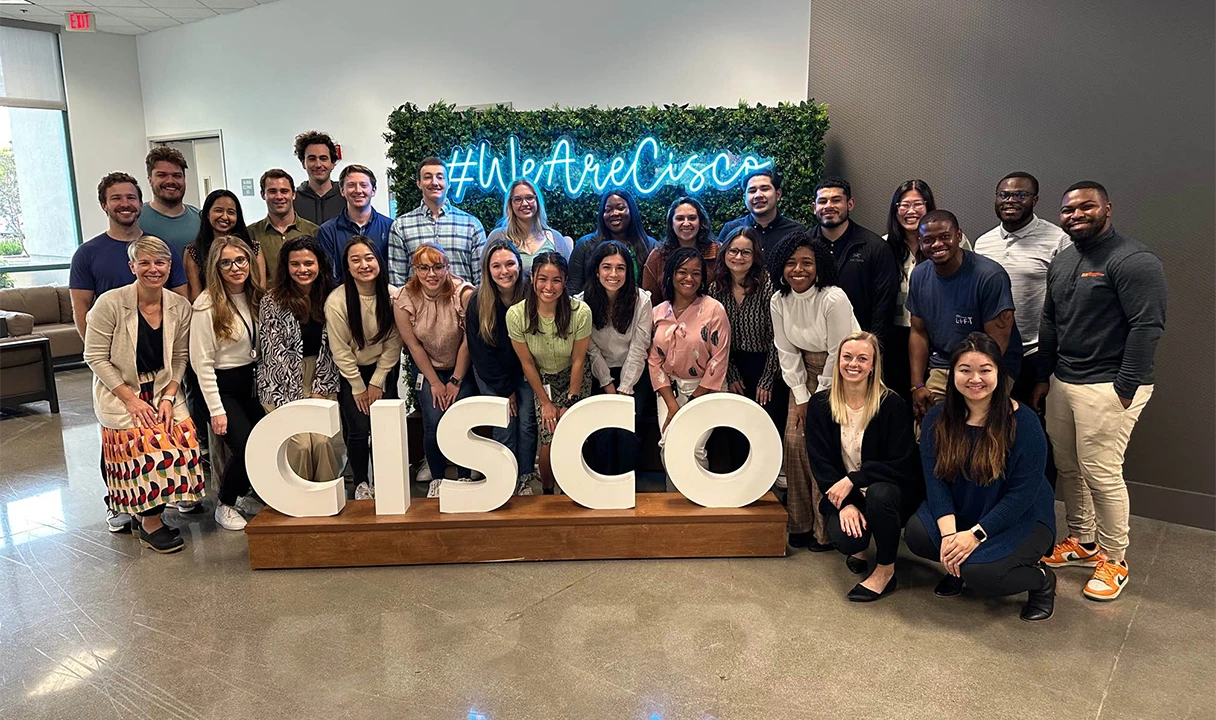
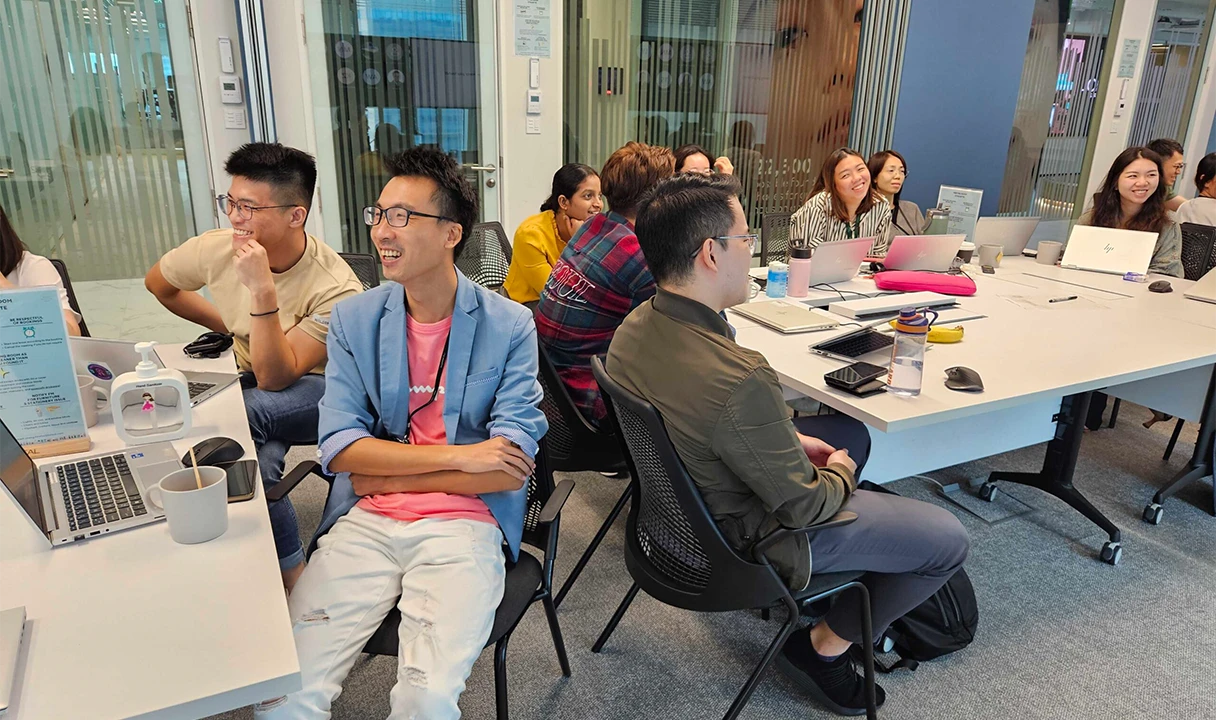
Congratulations Cisco LIFT-ers!
Celebrating our 7th year of partnership with Cisco's Leaders in Finance and Technology (LIFT) program.
Transforming numbers into compelling narratives
Bank of Singapore, a leader in Asian wealth management for over a decade, partners with StoryIQ to enhance data storytelling for its team.
Data storytellling for Dell leaders
We had a blast training Dell's FAP (Finance Advanced Program) in data storytelling.


Frequently Asked Questions
Do you have more questions?
We’d love to discuss your learning needs. Reach out and a member of our team will get back to you.