
When it comes to visualizing data, simpler is better. We want to make things as easy as possible for our audience. The less time and effort they spend interpreting our visuals, the more they’ll understand and engage with our message.
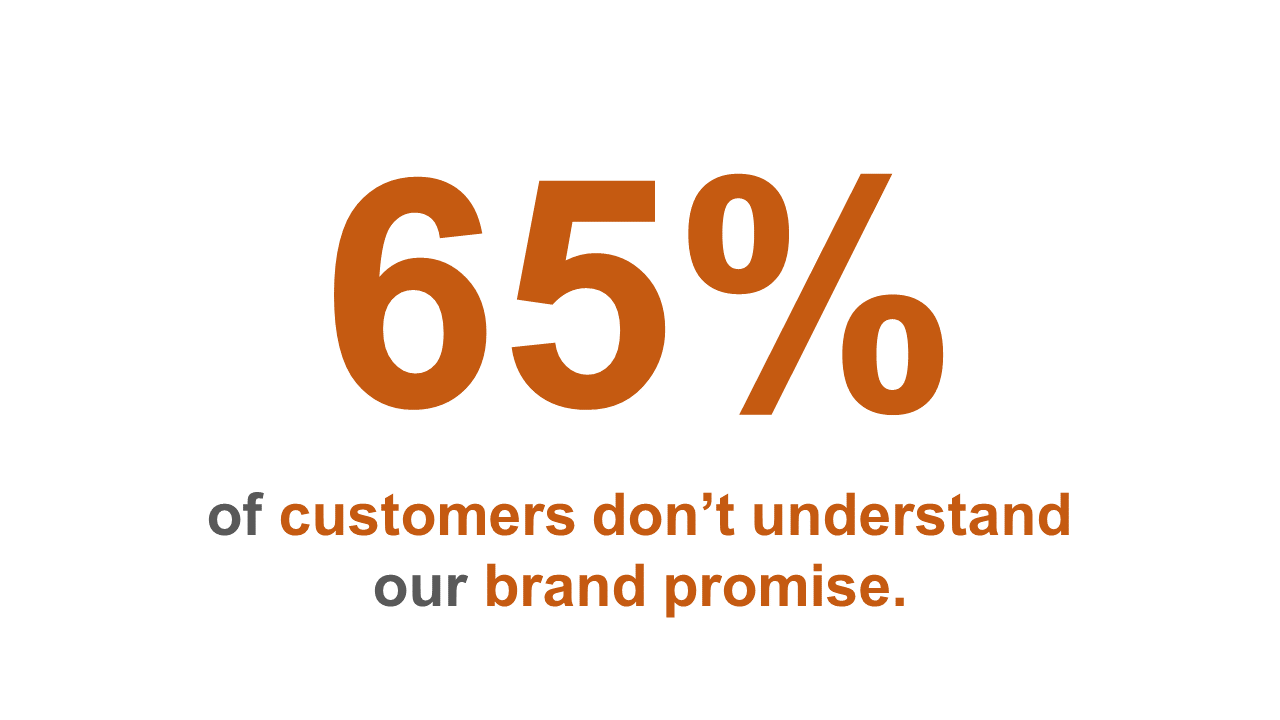
At its simplest, this means showing just a single number—no charts, tables, or diagrams, just plain text like the number below.
We’ll look at three types of impact metrics:
Simple text
Text with images
Multiple metrics
Now, let’s look at an example where impact metrics can improve our data story. This chart shows data from a company that surveyed its customers with questions like, “Do you understand our brand promise?” Customers could respond to each question with five choices, from “strongly disagree” to “strongly agree.”
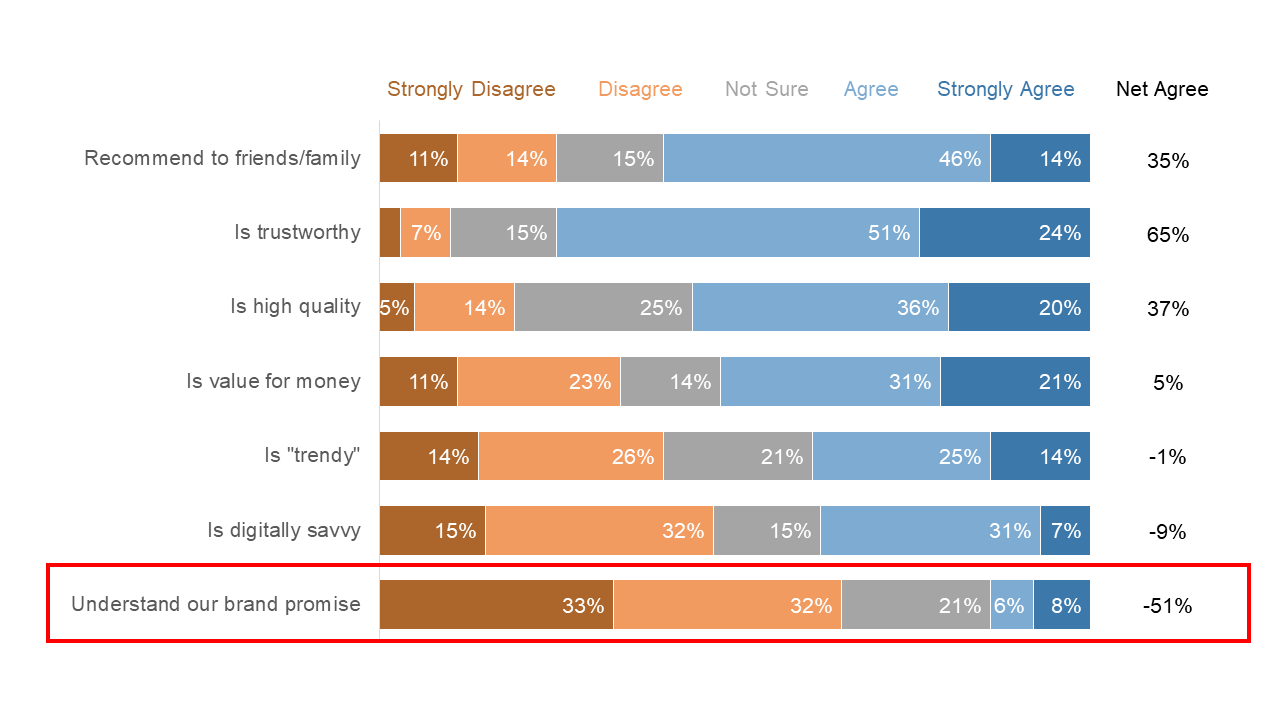
There’s nothing wrong with this chart if our goal is to present all the data and let our audience draw their own insights. But what if we’re giving a live presentation? And what if we have a story to tell, and we want our audience to follow our narrative?
I’m concerned about how many customers don’t understand our brand promise, and I want to grab my audience’s attention to motivate them to fix this issue.
But as I’m making my case for a clearer brand promise, my audience might start focusing on the other six questions in this chart instead.
1. Simple Text

A slide like this is so easy to create. It’s nothing more than a text box.
2. Text with images
Because this approach is so simple, it provides an opportunity to inject a bit of graphic design flair. We could re-imagine our slide with a hero image.

The image helps evoke some feelings that we may want to stir in our audience; in this case, empathy for our customers’ confusion. We could humanize our presentation a little more by sharing this woman’s story when presenting this slide. For example, ‘This is one of our survey participants, named Airelle. Airelle is one of many customers we talked to who liked our product offering but felt confused and unsure of what our brand promise means. We need a strategy to help Airelle understand what our brand promise means to her.’
Let’s look at another example of an impact metric with an image. This time we’ve focused on the positive story of the 60% of customers who would recommend us to family or friends.

There’s a simple formula in both slides that we’re following to create an impact metric with an image.
Choose a relevant background image. In this case, we’ve got some happy customers pointing at our impact metric as if to recommend us.
Make sure the image isn’t too busy or distracting. Here we’ve just cropped out the happy customers so there are no distracting background elements.
Ensure that the text in our impact metric is easy to read and stands out against the background. In this case, because the image is cropped, we have a white background, making it easy to ensure that our text is readable.
An easier option is to crop the whole image to create a white space where you can add the impact metric text, like in the example below.

Alternatively, we can use dark hues or black for our background and then use light colors or white for our fonts. For example, the impact metric below emphasizes that our brand is not perceived as tech-savvy

If we use a busy background image, like the one below, and put text over it, we end up with an impact metric slide that’s distracting and hard to read.

3. Multiple Metrics
We don’t have to limit our impact metrics to one number per slide. Let’s say that we want to highlight the three areas where our brand is doing best. So we want to call out that our brand is trustworthy, high quality, and value for money. We could lay three impact metrics out on a slide like this.
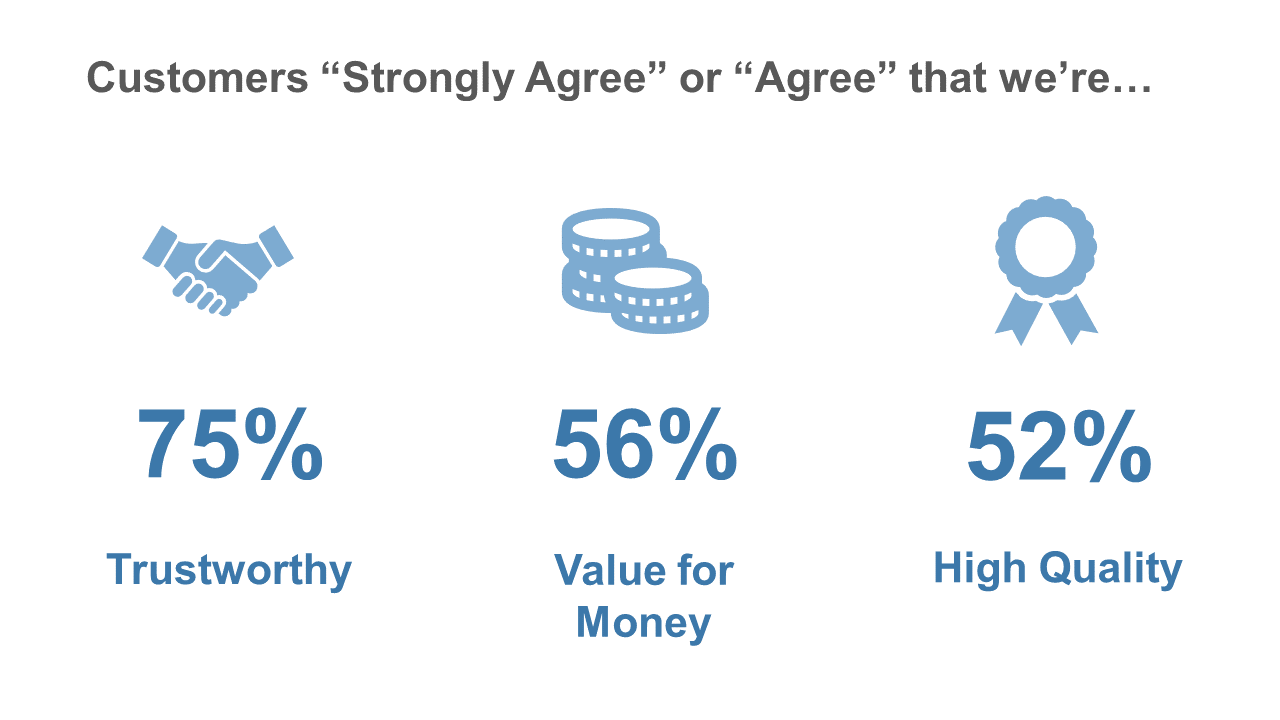
Three photographs could get pretty busy, so we’ve added some icons instead. These icons are straight from the free icon library in Microsoft PowerPoint. Simple icons keep the slide clean and free of clutter, while adding visuals that help our audience connect with the story.
If you want to lead your audience through a story, consider whether you can distill your data to a few simple numbers that drive home your point. It might be time to try the simplest form of data visualization: impact metrics.
To learn more, check out our Data Storytelling for Business Course , where you can practice and implement techniques like impact metrics.