All businesses live or die by the quality of their decisions. Think of any company you admire: to grow from nothing into a success story, they had to make a series of tough calls. It doesn’t matter what your role is or what industry you’re in—helping businesses make better decisions is vital for any organization. And the fuel that drives all that decision-making is data and analytics.
Everyone is now racing to become more data-driven, not just analysts and data scientists. It would seem that the way forward for business professionals is simple: Collect good data, analyze that data, and then allow the data to lead stakeholders into a promised land of good decision-making that drives business value.
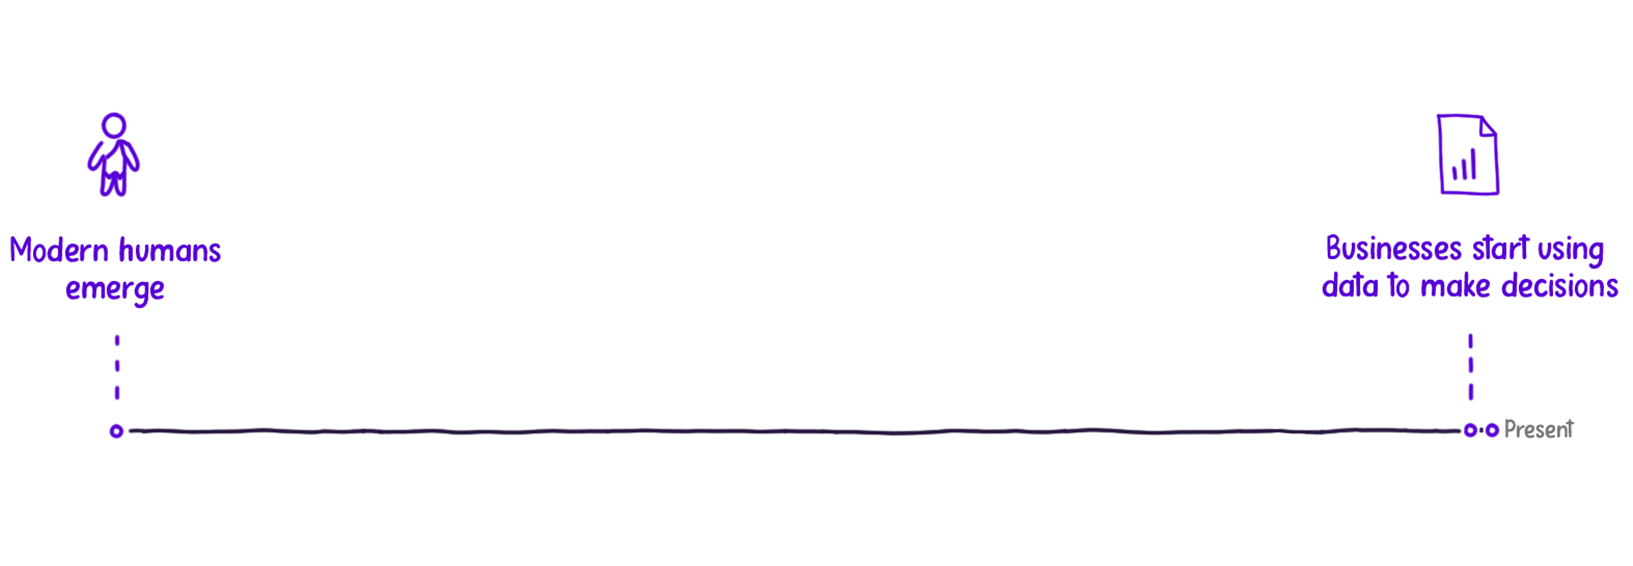
Unfortunately, it’s not that simple. Data, facts, and numbers alone rarely get us excited and motivated. Data needs to be presented to decision-makers. And decision-makers are human. Like all humans, they can miss important takeaways, get overwhelmed by large amounts of information, and let their internal biases get in the way. And who can really blame them? In the context of human history, we’ve been looking at data reports and dashboards for an extremely limited amount of time:
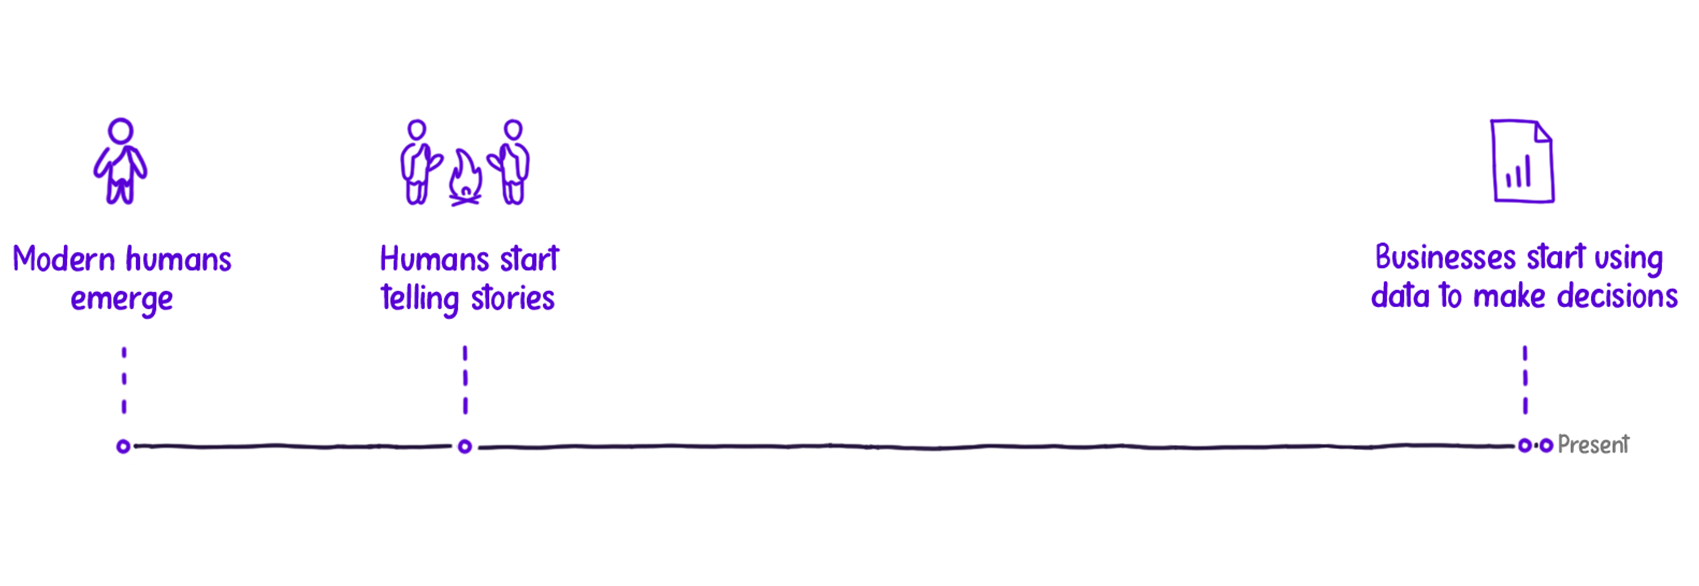
The good news is that humans have developed an extremely effective method for communicating information in a way that cuts through the noise, is memorable, and propels individuals to act. This method, employed by journalists, film directors, and your friends around a campfire, is storytelling.
Stories have an intrinsic, magnetic ability to draw us in and keep us engaged. Millenia after the first stories were etched on cave walls, we’re now uncovering that storytelling is more than a time-honored art form; it’s an integral component of cognition, deeply embedded in our brain’s internal processes.
Our overwhelming desire to see the impact of facts and events on human characters was demonstrated in a 1944 study by psychologists Fritz Heider and Marianne Simmel. They showed participants an abstract film depicting two triangles and a circle bouncing around the screen.
Here is a representation of key frames from the Heider-Simmel Illusion:

Despite the film’s abstract nature, participants personified the shapes when asked to interpret what they saw. They attributed intent, conflict, and emotions to the geometric figures. Furthermore, the one-minute video, as brief as it was, registered different stories for different people. The experiment revealed that humans intuitively lean on storytelling to absorb, comprehend, recall, and relay even the most abstract information.
One thing is clear: we are hard-wired to engage with stories. Storytelling offers structure and flow, making complex information more accessible, understandable, and meaningful. It is no wonder that in communicating something as complex as data, storytelling serves as a powerful tool through which data’s value can make an impression.
Harnessing the potency of storytelling in business is not just a strategic move—it’s a return to our brain’s storytelling roots. By weaving our insights into stories, we capitalize on tens of thousands of years of evolutionary hard-wiring, making our messages both more consumable and memorable.
Why is data storytelling important?
More and more organizations worldwide recognize why data storytelling is essential in making critical business decisions. Unfortunately, data literacy and communication skills have not kept up with the growth of data availability. Consequently, we continue to encounter reports and presentations that confuse and alienate the people relying on them to make decisions.
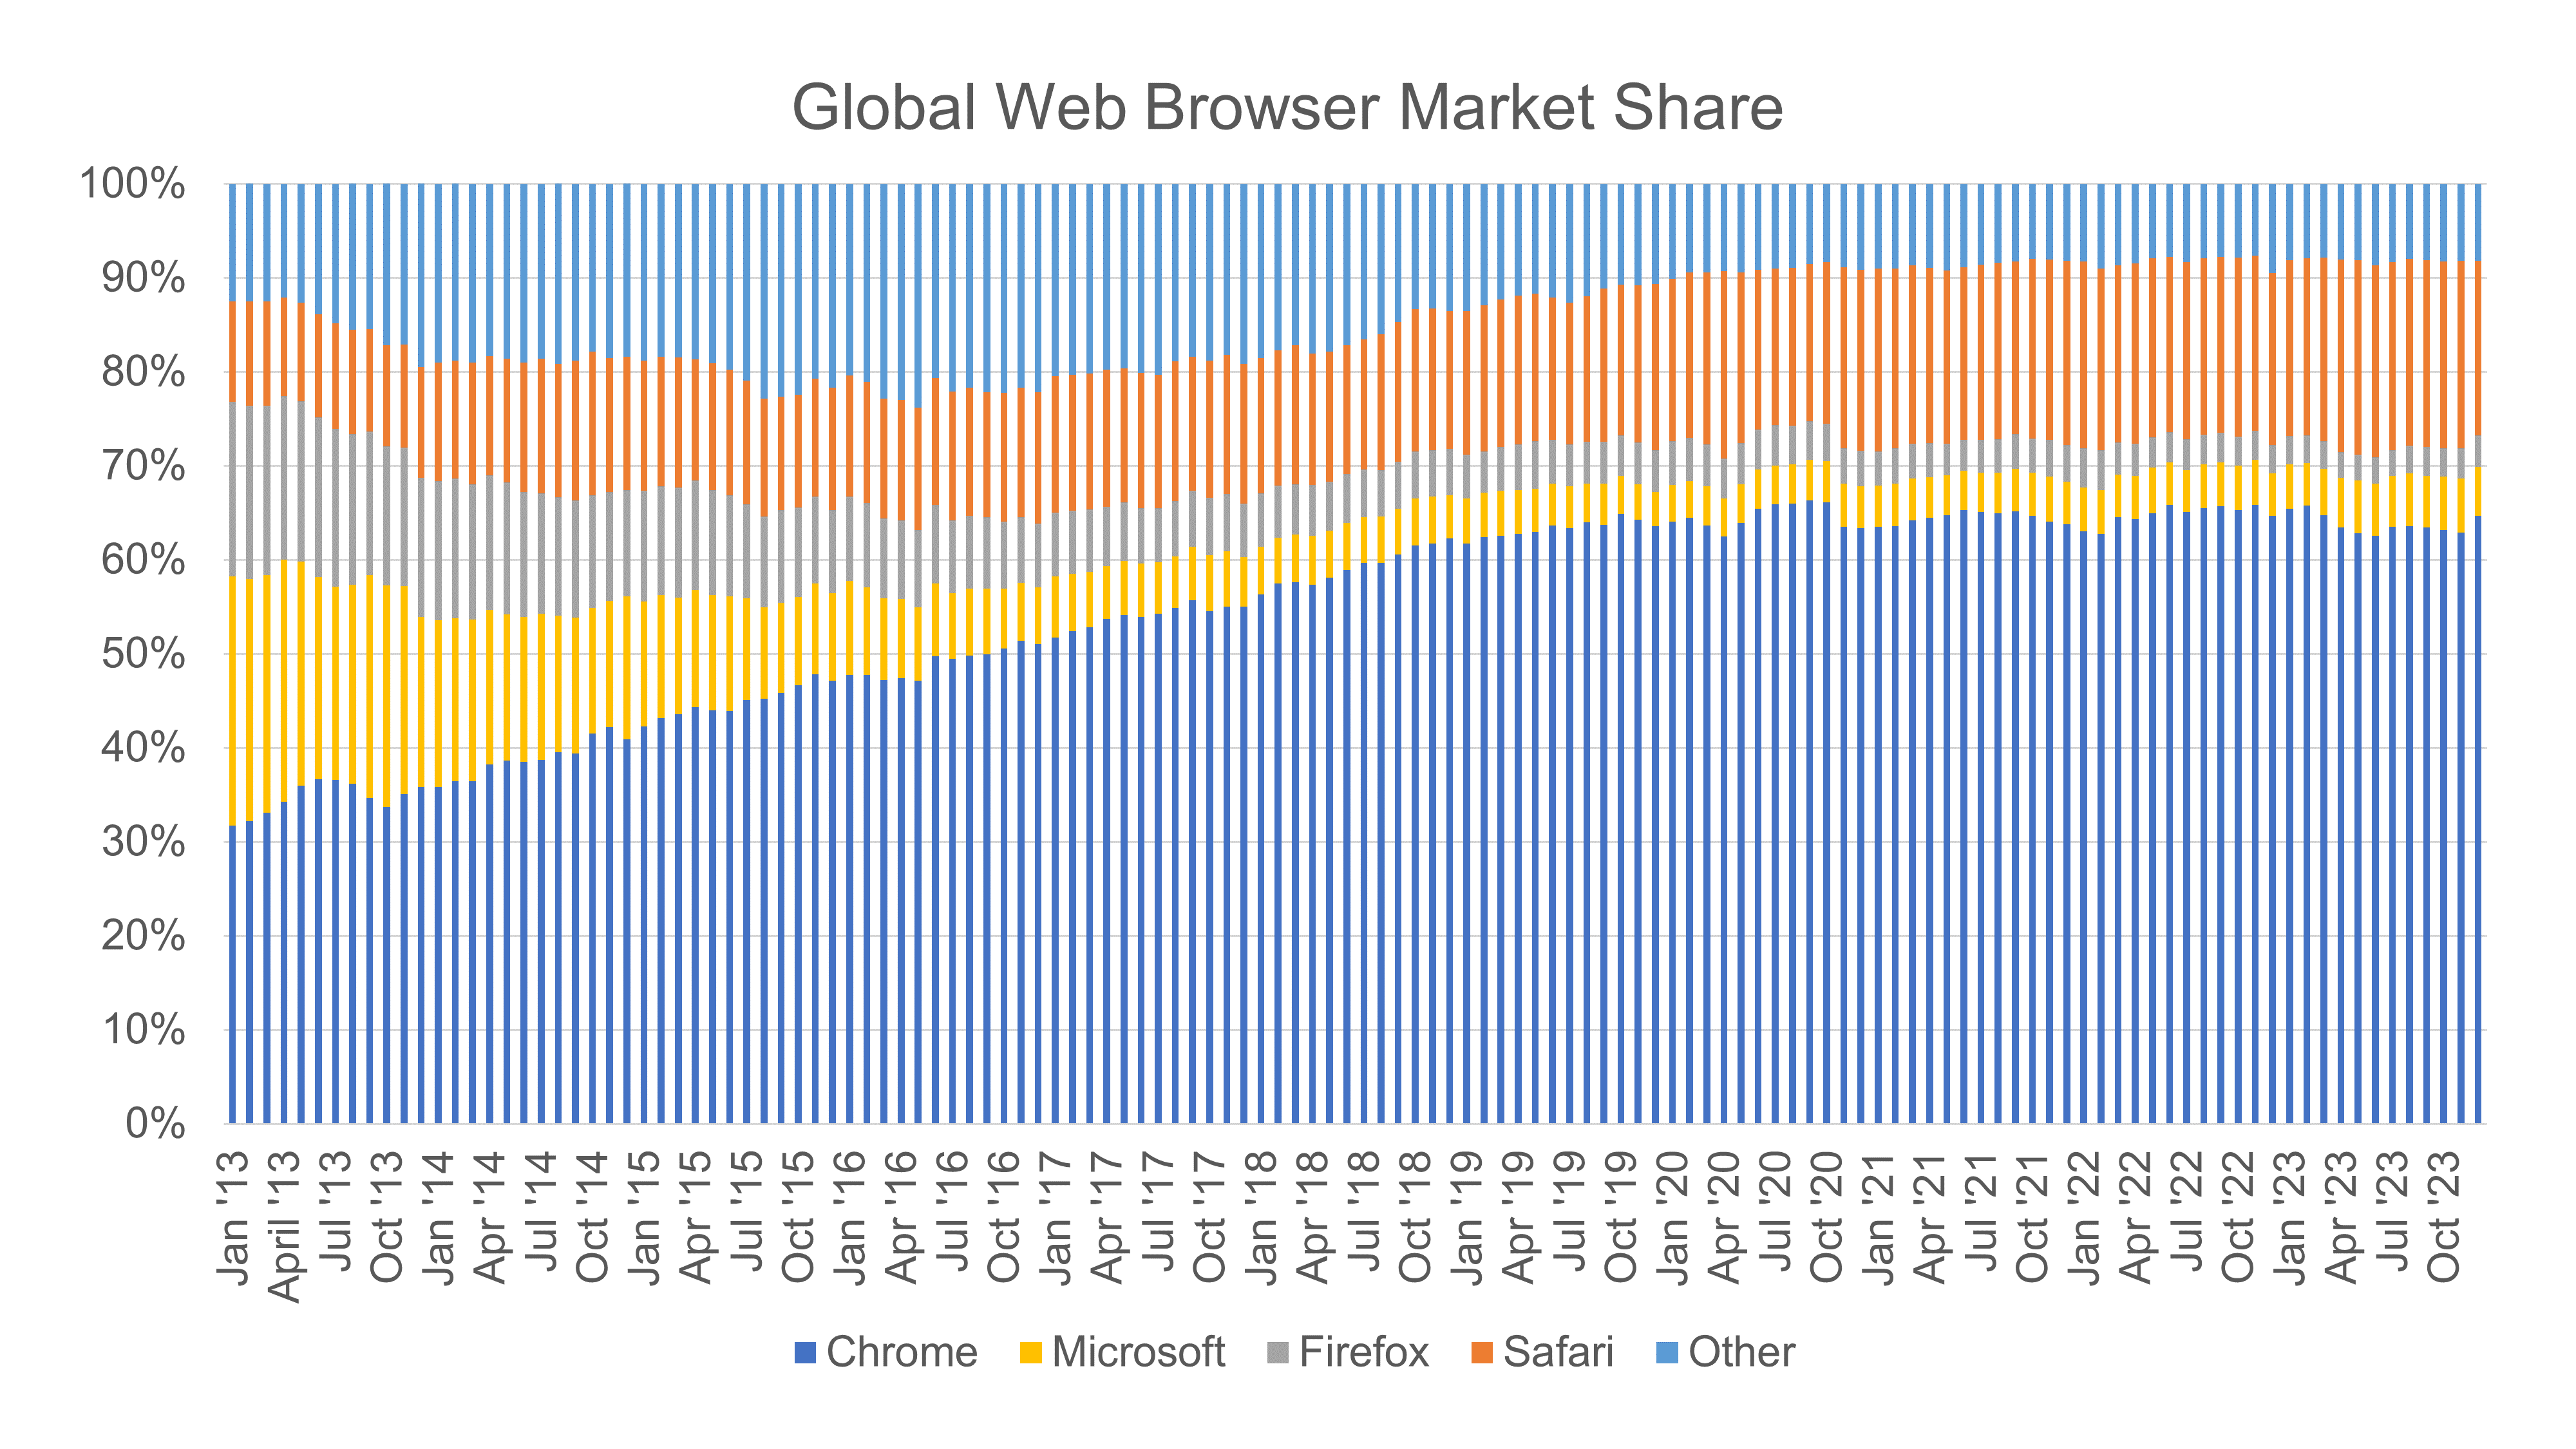
Data storytelling enables us to create reports and presentations that deliver clear and crisp insights that can propel people, especially stakeholders, to action. Take the chart below, which was created using default settings in Microsoft Excel. No data storytelling techniques have been applied to it. Can you identify the key insights this chart’s creator intends to convey?
Let’s make those key insights easier to extract by transforming this chart. The version below takes the same underlying information and use data storytelling best practices to the chart or graph design.
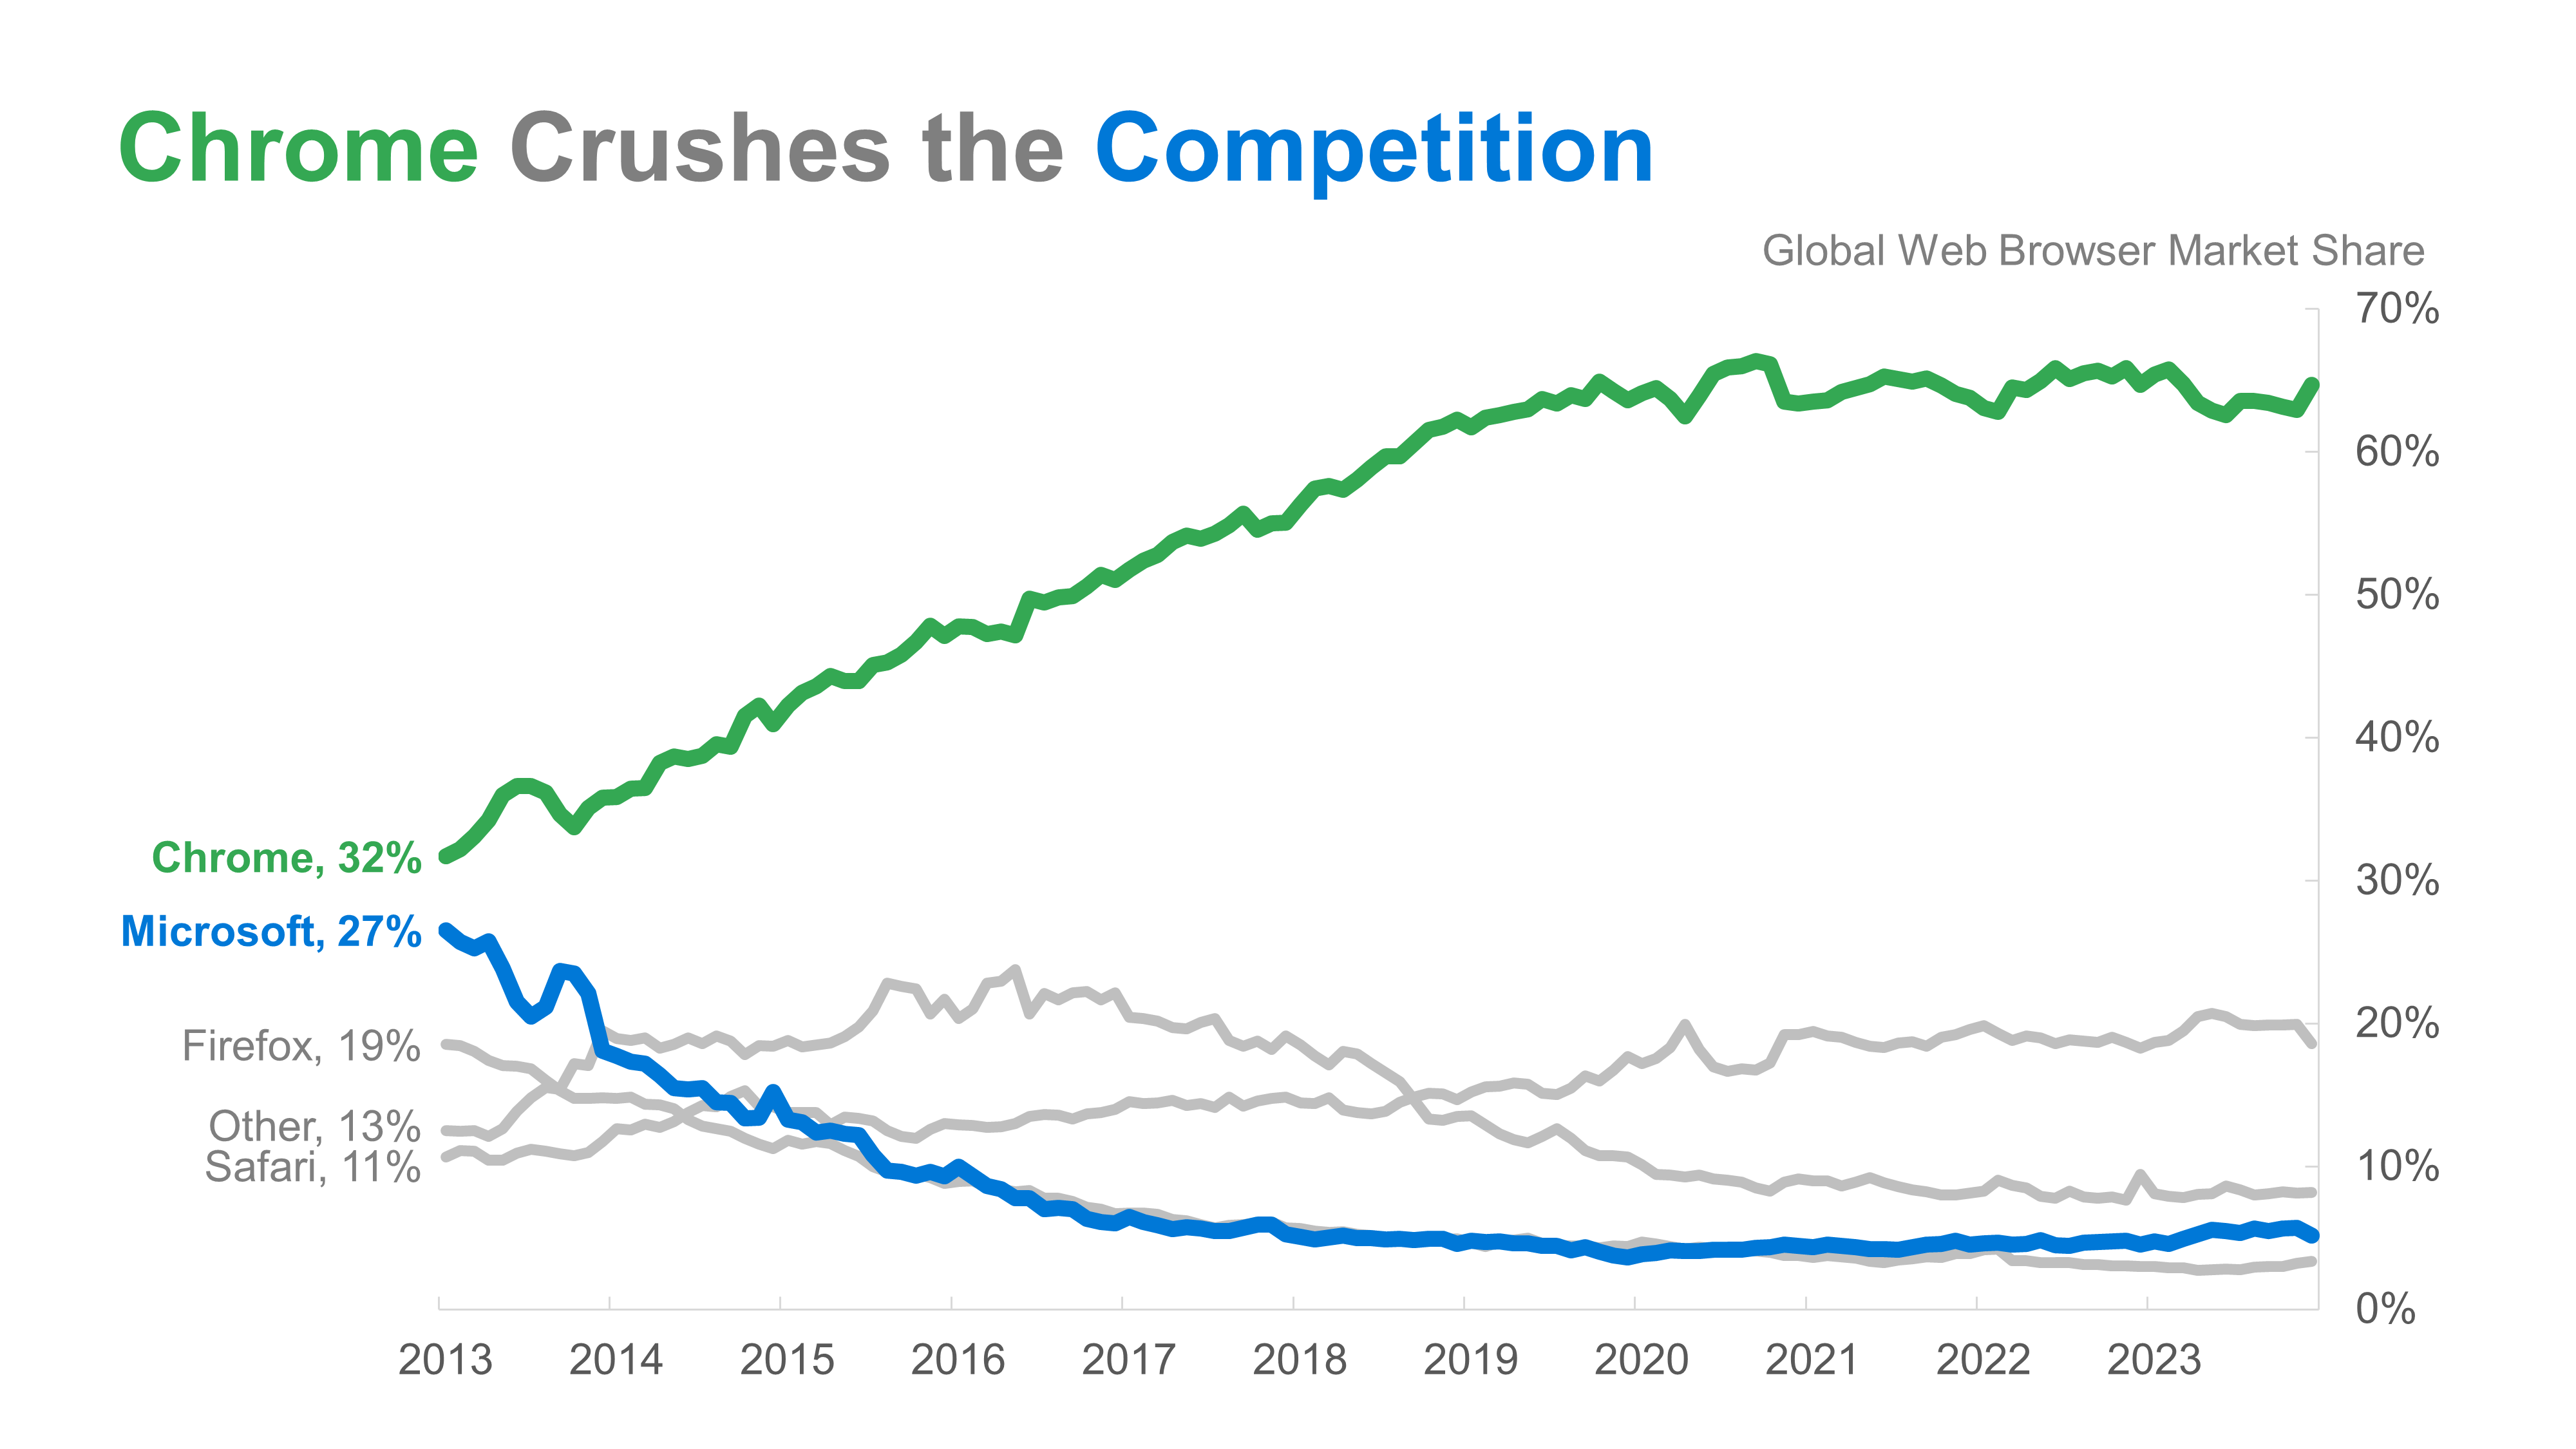
In the improved version, the take-home message is instantly apparent with a concise, descriptive title. The chart is free of clutter and distractions, and color has been used sparingly to focus on the chart components that support the key insight. When every element serves a purpose, the data story shines.
To see the step-by-step transformation of this data visualization, check out these five simple steps to tell a data story.
What are the three key components of Data Storytelling?
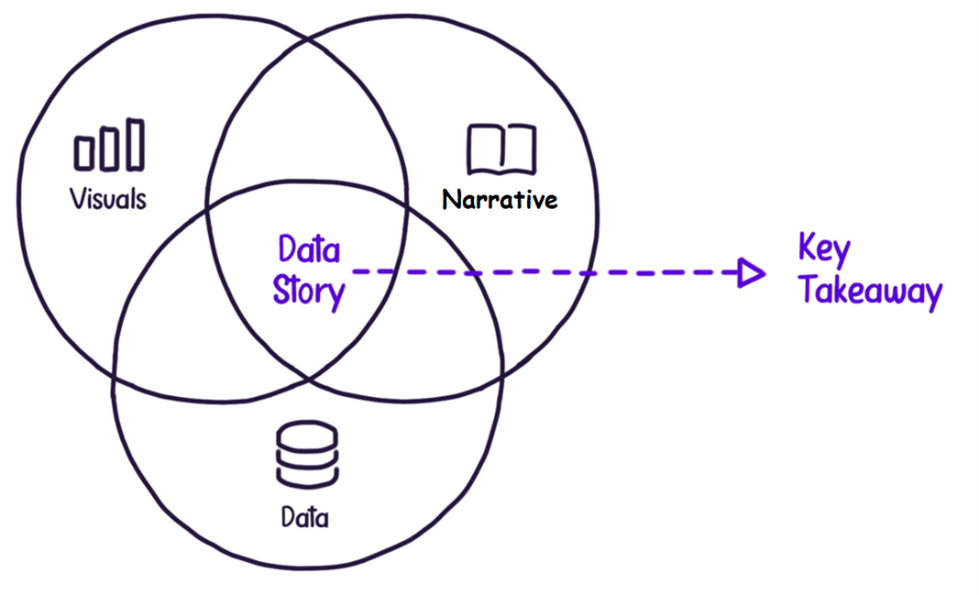
Effective data storytelling, like what we saw above, involves merging three key components that make a message worth remembering: data, visuals, and narrative. Combined, these three elements create a space where our data story’s key takeaway can shine.
1. Data
Data offers the grain of truth that is a grounding force for a powerful and impactful message. Because data reflects an occurrence or action, it can immediately offer credibility and firmness when putting a message across. Without data, a message can seem lofty and unfounded. Good data provides the backbone that makes a message stand tall.
2. Visuals
While data might appear like an enigma for most people, Visuals or data visualization, in turn, aim to demystify the data and reveal the patterns and trends that might be otherwise elusive to the human eye. We can draw valuable insights based on how the data points behave through a bar, a line, and other visual representations.
3. Narrative
If data and visuals possess the insight our audience needs, the narrative is the vehicle through which the insight is delivered. It is the most natural way humans make sense out of chaos. A strong narrative or story with data can weave different points cohesively and thoughtfully so the audience receives, understands, and remembers the complete picture.
Combining all three, we can create a data story worthy of carrying a meaningful and memorable key takeaway. Together, data, visuals, and narrative can be a powerful force in communication.
How can we start applying data storytelling?
Knowing why data storytelling is important is one thing, but knowing how to apply it and become a data storyteller is another. Integrating data storytelling into how we work should not be rocket science.
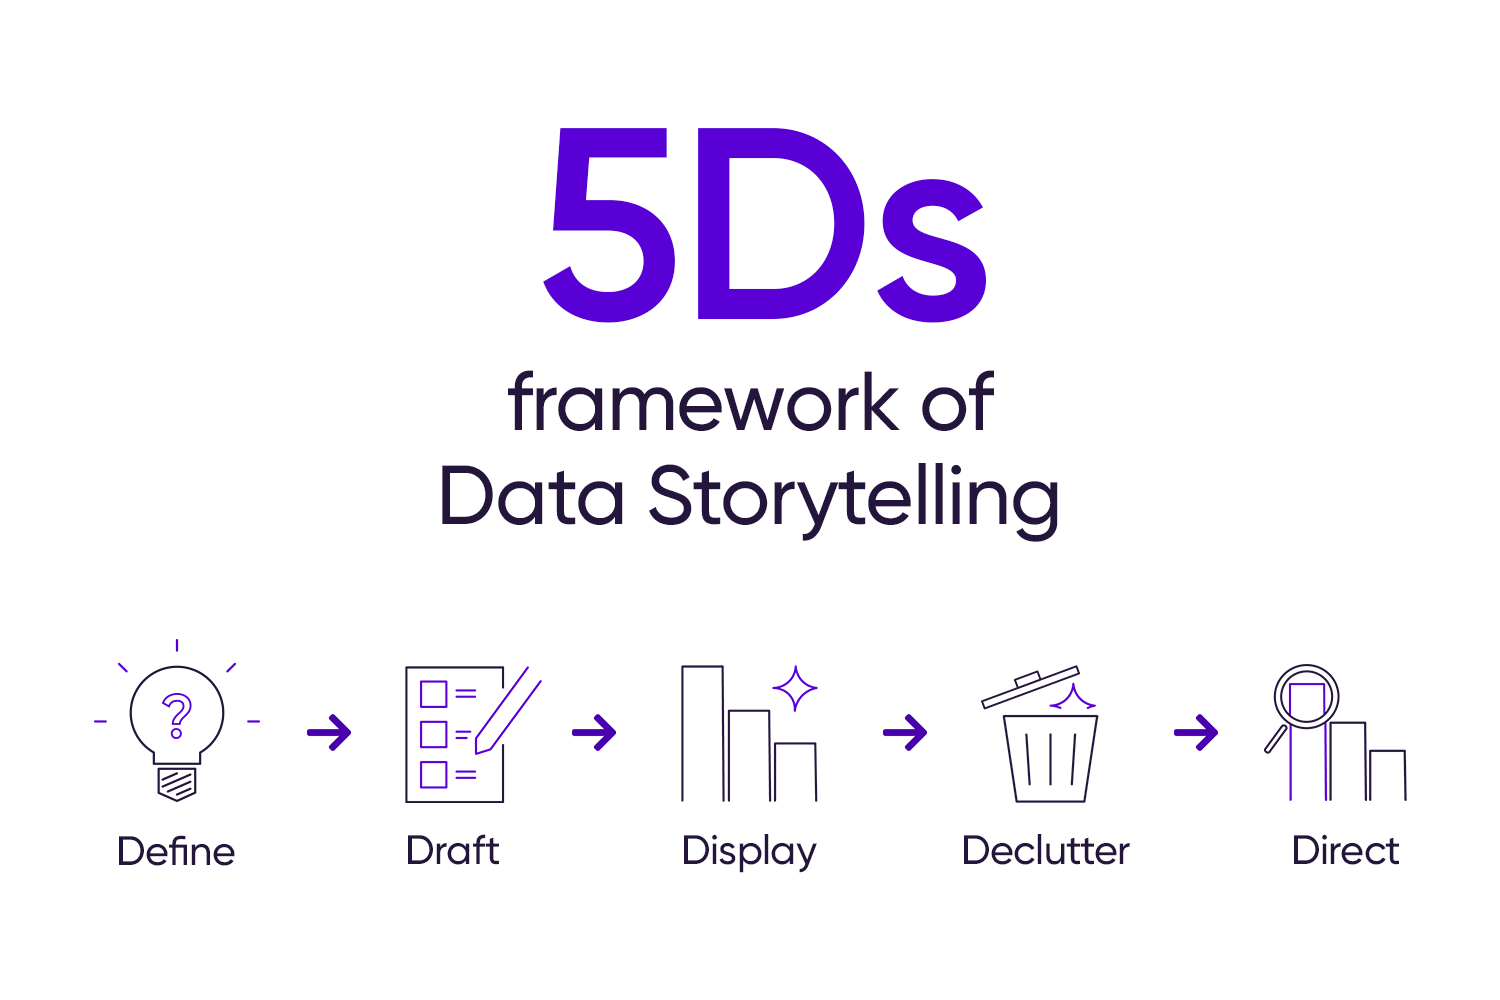
At StoryIQ, we’ve captured the key steps in applying data storytelling to our work through the 5 Ds of Data Storytelling:
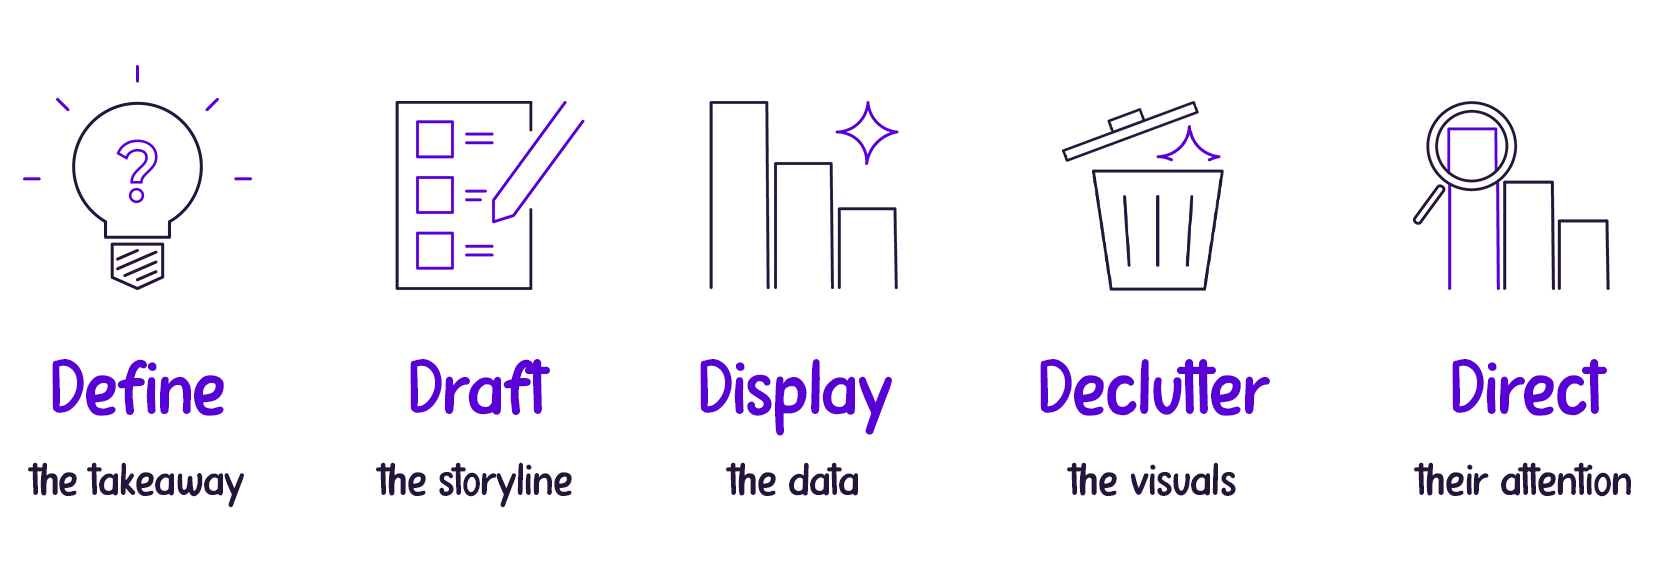
1. Define the key takeaway.
Like most creative journeys, we must start with the central idea before building the other parts. This first step invites us to examine the data’s purpose and aims to define the compass that will guide the rest of the decisions we must make to create our data story.
2. Draft the storyline.
In a typical business context, we face multiple messages and data points we feel we must highlight for our audience. Drafting the storyline helps keep our central message in check, ensuring every point we include builds towards another, so every piece of our story plays a crucial part.
3. Display the data.
This is the time to show and not just tell a story. Thinking about the Display forces us to consider not what kind of chart looks good for us but what type of chart works best to communicate the insight to our audience effectively.
4. De-clutter the display.
The default charts we can create using tools like Microsoft Excel or Google Sheets typically come with elements that might not be very useful in a presentation context. De-cluttering the display helps ensure that every part of our chart or graph serves a purpose in delivering the message most clearly and cleanly.
5. Direct the attention of our audience.
The final step is to apply visual signals on our clean chart to support the story. Through thoughtful highlights, we can guide the audience on where to look to let the core idea flow as smoothly as possible.
Are you excited to apply the 5 Ds of Data Storytelling to your charts? See the 5Ds of Data Storytelling in action to learn how to begin transforming how you communicate about data.
Want to dive deeper into the 5Ds and apply this in a more comprehensive example? Check our book, Data, Story, Action!
To master the art of Data Storytelling and find other learning opportunities on data communication, check our scheduled workshops or contact us to set up an exclusive class.
Learn with us and earn your certificate in Data Storytelling. See you at our next workshop!