Data Visualization Examples

A running collection of practical best practice data visuals that apply design and storytelling principles.

What makes a successful data visualization? Data visualizations fulfill their purpose when they can reveal insights that we might otherwise miss or struggle to find when we view a raw dataset.

Using design and storytelling principles, data visuals enable us to comprehend insights from complex data and convey these insights to those who rely on them to make better decisions.

We’ve gathered and recreated a growing list of data visualization examples to demonstrate what practical and clear data visuals might look like. See how you can apply similar techniques to your own data stories.

1. Straight and narrow: Use bars rather than irregular shapes to show comparisons with clarity.

Use bar charts to clearly show comparisons across categories with proper sorting and selective highlighting. We’ve created some examples based on the real data below.

Original Visual


Improved Visual


Original Visual


Improved Visual


2. Turning tables: Opt for bar charts instead of tables to visualize growth.

Bar charts can also be used for a linear x-axis, particularly when focusing on a specific period with a stand-out value.

Original Visual


Improved Visual


3. Choose wisely: Pick a dumbbell over a pizza (pie) to visualize segments over a timeline.

While it can be entertaining to play around with how we visualize data, we might also lose clarity and directness when it comes to the insight the data can offer.

Original Visual

Turning the pie chart into a dot plot can better reveal the story over time. In this case, A dumbbell dot plot shows connections between points in time for each CEO. To modify the dumbbell dot plot this way, format the data series so the lines appear as solid, thick bars without markers on either end.


Improved Visual


4. Donuts are okay in moderation. Just keep the slices minimal to neatly capture parts of a whole.

Donut charts can be an acceptable way of visualizing composition as long as the number of slices featured doesn’t compromise readability.

Spotlight the dominant categories by highlighting key sections and capturing their total in the middle. When helpful, show the breakdown of aggregate categories.

See the various examples below:

Original Visual


Improved Visual


Original Visual


Improved Visual


Original Visual


Improved Visual


5. Sometimes the best chart…is not a chart. Put the spotlight on the crucial metric instead.

Take a break from charts and feature the key metric on your slide. A simple thematic image can further emphasize the message to drive the point forward. We call this type of visual Impact Metrics.

Improved Visual


Improved Visual


6. Tables aren’t completely off the table: Just remember to make it easy to scan and see standouts on a list.

Tables can be a powerful way to visualize data when the primary goal is to show specific values or appreciate the ranking of data on a list. Keep tables de-cluttered by aligning categories consistently and using white space to create groupings instead of lines.

Original Visual


Improved Visual


7. Make the data shine: Scatter plots can single out outliers in a dataset.

Scatter plots are excellent at visualizing performance based on the variables reflected on the x-axis and the y-axis.

Using the same data as in a previous donut chart, we can use a scatter plot to show more detail about what makes Russia and Botswana outliers in rough diamond production.

Original Visual


Improved Visual


8. Stay single: Make trend comparison easier by splitting up the lines to create small multiple charts.

Scatter plots are excellent at visualizing performance based on the variables reflected on the x-axis and the y-axis.

Small multiple charts allow us to place categories in a series of separate charts following the same scale and axes for easier comparison. The small multiple line charts below allow us to compare the trends of each country side-by-side, which could be harder to do if the lines were all in one plot area.


9. A single line can speak volumes: Use line charts to reveal trends and current standing in one view.

If you want to compare data with accuracy, a line chart works well, particularly with time-based data. Not only can we appreciate the trend for each category, but we can also see their most recently featured ranking based on the location of the endpoints.

Here is an example featuring market cap data:

Here is another example featuring traffic congestion data:

Original Visual

Improved Visual


10. Just flip it to read it: Flip the axis to fit a longer list of categories.

Vertical or column bar charts can sometimes have limited space to fit bars of drastically different lengths, forcing us to alter the chart and making the data trickier to read. Using a horizontal bar chart instead allows more space for the bars to expand and makes it easier to scan lengthy category names.

Original Visual

Improved Visual


11. Minimal, not messy: A cleaned-up scatter plot makes it easier to spot the outlier.

Charts don’t always have to feature business data. The example below features pop culture data using scores from the critics and the audience of a popular media franchise. Simplifying the visual and focusing more on the plot points rather than the images allow the insight to shine.

Original Visual

Improved Visual


12. Plot it, don’t stack it: Track sales growth with ease.

While stack bar charts look nice and compact, the uneven base can make it very difficult to compare values from bar to bar.

A dot plot can easily show the degree of change between two points in time simply by revealing the space between them. A simple table capturing the rate of change also makes it easy to appreciate which categories are performing better than others. With a clearer data visual, we can better decide the meaningful insight to highlight for our audience.

Original Visual

Improved Visual


13. Level up by using bars: A 100% stacked bar chart can visualize an inverse proportion between categories.

Bars are a great way to visualize values simply by their lengths, even without data labels.

For the example below, the two types of skills can start on either end of each bar, clearly visualizing proportions for every position identified.

Original Visual

Improved Visual


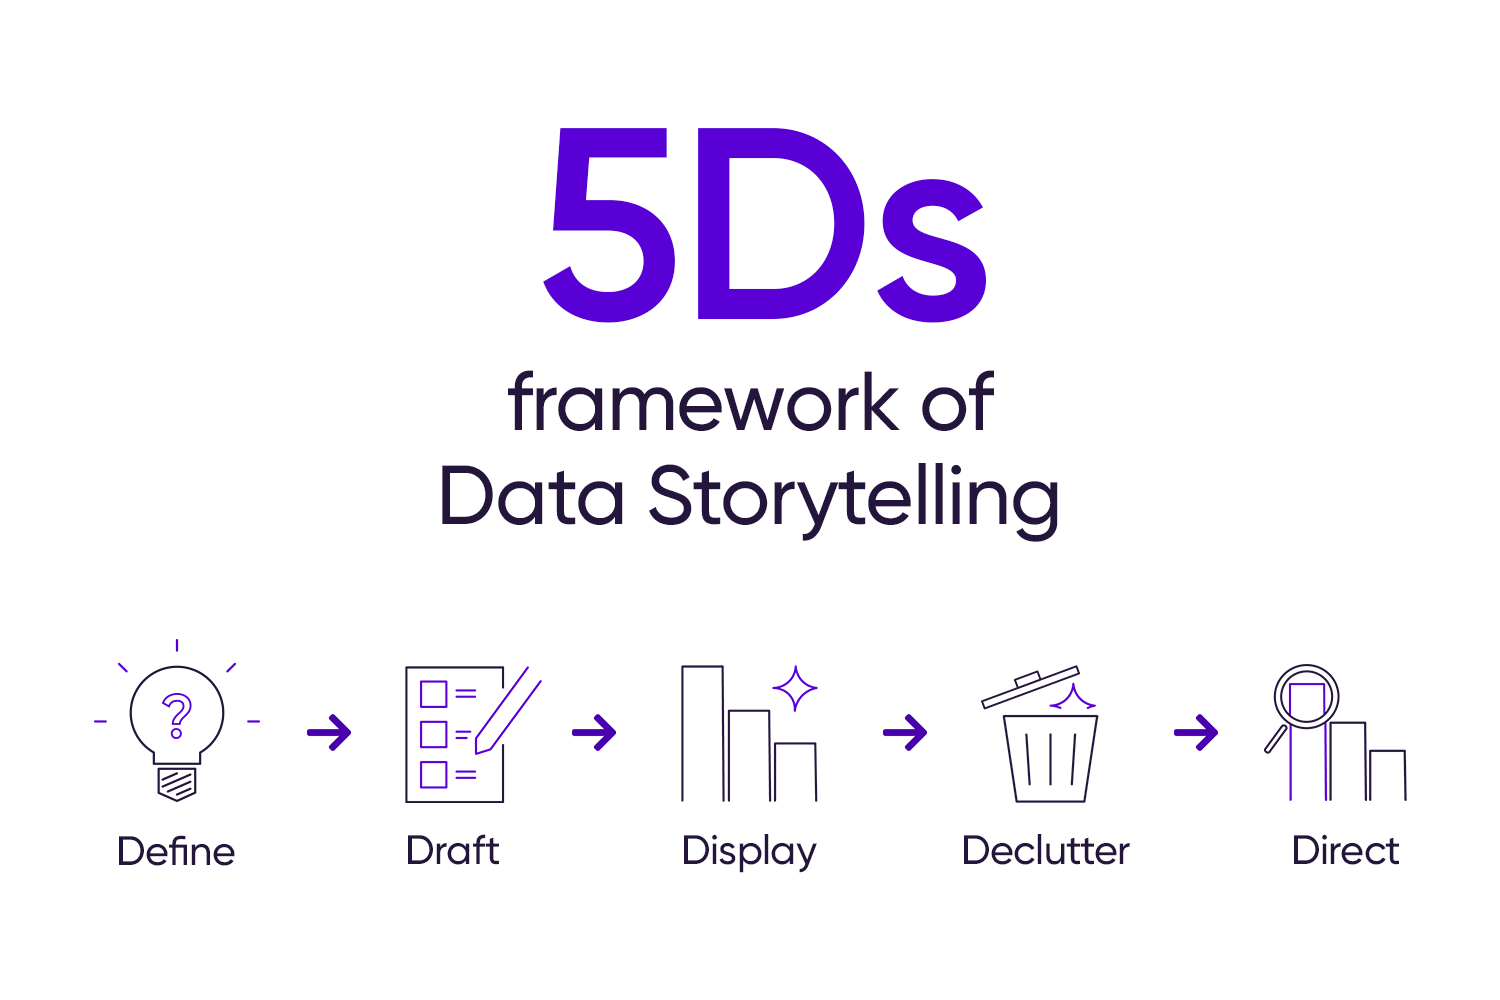
Want to explore the 5Ds further and apply them to a more comprehensive example? Check out our book, Data, Story, Action!

To master the art of data storytelling and find other learning opportunities in data communication, check out our scheduled workshops or contact us to set up an exclusive class. Learn with us and earn your certificate in Data Storytelling. See you at our next workshop!

References

Nuclear energy producers data. https://www.visualcapitalist.com/the-worlds-biggest-nuclear-energy-producers/

Gold reserves data. https://www.madisontrust.com/information-center/visualizations/which-world-countries-have-the-most-gold/

Premier League stoppage data. https://www.bbc.com/sport/football/articles/czrxmwnnekdo

Papa John’s leadership data. https://www.forbes.com/sites/forbesdigitalcovers/2018/07/19/the-inside-story-of-papa-johns-toxic-culture/?sh=53689d263019

Global population data. https://x.com/Maps_US_EU/status/1608805049903501313

Rough diamond production data. https://www.visualcapitalist.com/cp/world-diamond-mining-by-country/

Military expenditure data. SIPRI Military Expenditure Database, April 2024. https://www.reddit.com/r/dataisugly/comments/1ca8npc/2_colours_for_15_countries/

https://www.facebook.com/sipri.org

Premier league penalties data. https://www.bbc.com/sport/football/articles/czrxmwnnekdo

Global album sales data. https://www.ifpi.org/taylor-swift-seventeen-and-morgan-wallen-top-ifpi-global-album-charts/

Rough diamond production data. https://www.visualcapitalist.com/cp/world-diamond-mining-by-country/

Rough diamond trend data. https://www.info-diamond.com/rough/; https://www.info-diamond.com/rough/world-production.html

Market Cap data. https://companiesmarketcap.com/

MMDA data posted by @rogelalgero. https://www.reddit.com/r/Philippines/comments/1d7hhdw/today_i_learned_that_the_number_of_motorcycles/

Business World Top 100 Corporations in the Philippines. https://www.bworldonline.com/infographics/2021/12/20/418445/comparison-of-sectoral-performance-in-2020/

X-Men data. https://www.reddit.com/r/dataisbeautiful/comments/1cel54l/oc_how_does_xmen_97_stack_up_against_past_xmen/

Leadership vs. Technical skills data. The Fourth Wall:
https://www.facebook.com/photo/?fbid=122168069102071377&set=pcb.122168069330071377

Similar posts

A Data Storyteller’s Guide to Better Slide Design

Apply these simple techniques to quickly transform busy slides into a clear, polished presentation for your stakeholders.

Applying Color Harmony for Maximum Impact

Color harmony is crucial in designing aesthetically pleasing graphics that ensure clarity and accessibility for a wider audience.

Are You Presenting Your Data the Right Way?

Use the Presentation Medium Selection Framework to identify the most suitable approach to deliver your data story

Sign up to hear about our upcoming courses and events: