Display Decider: A Quick Guide to Selecting Charts

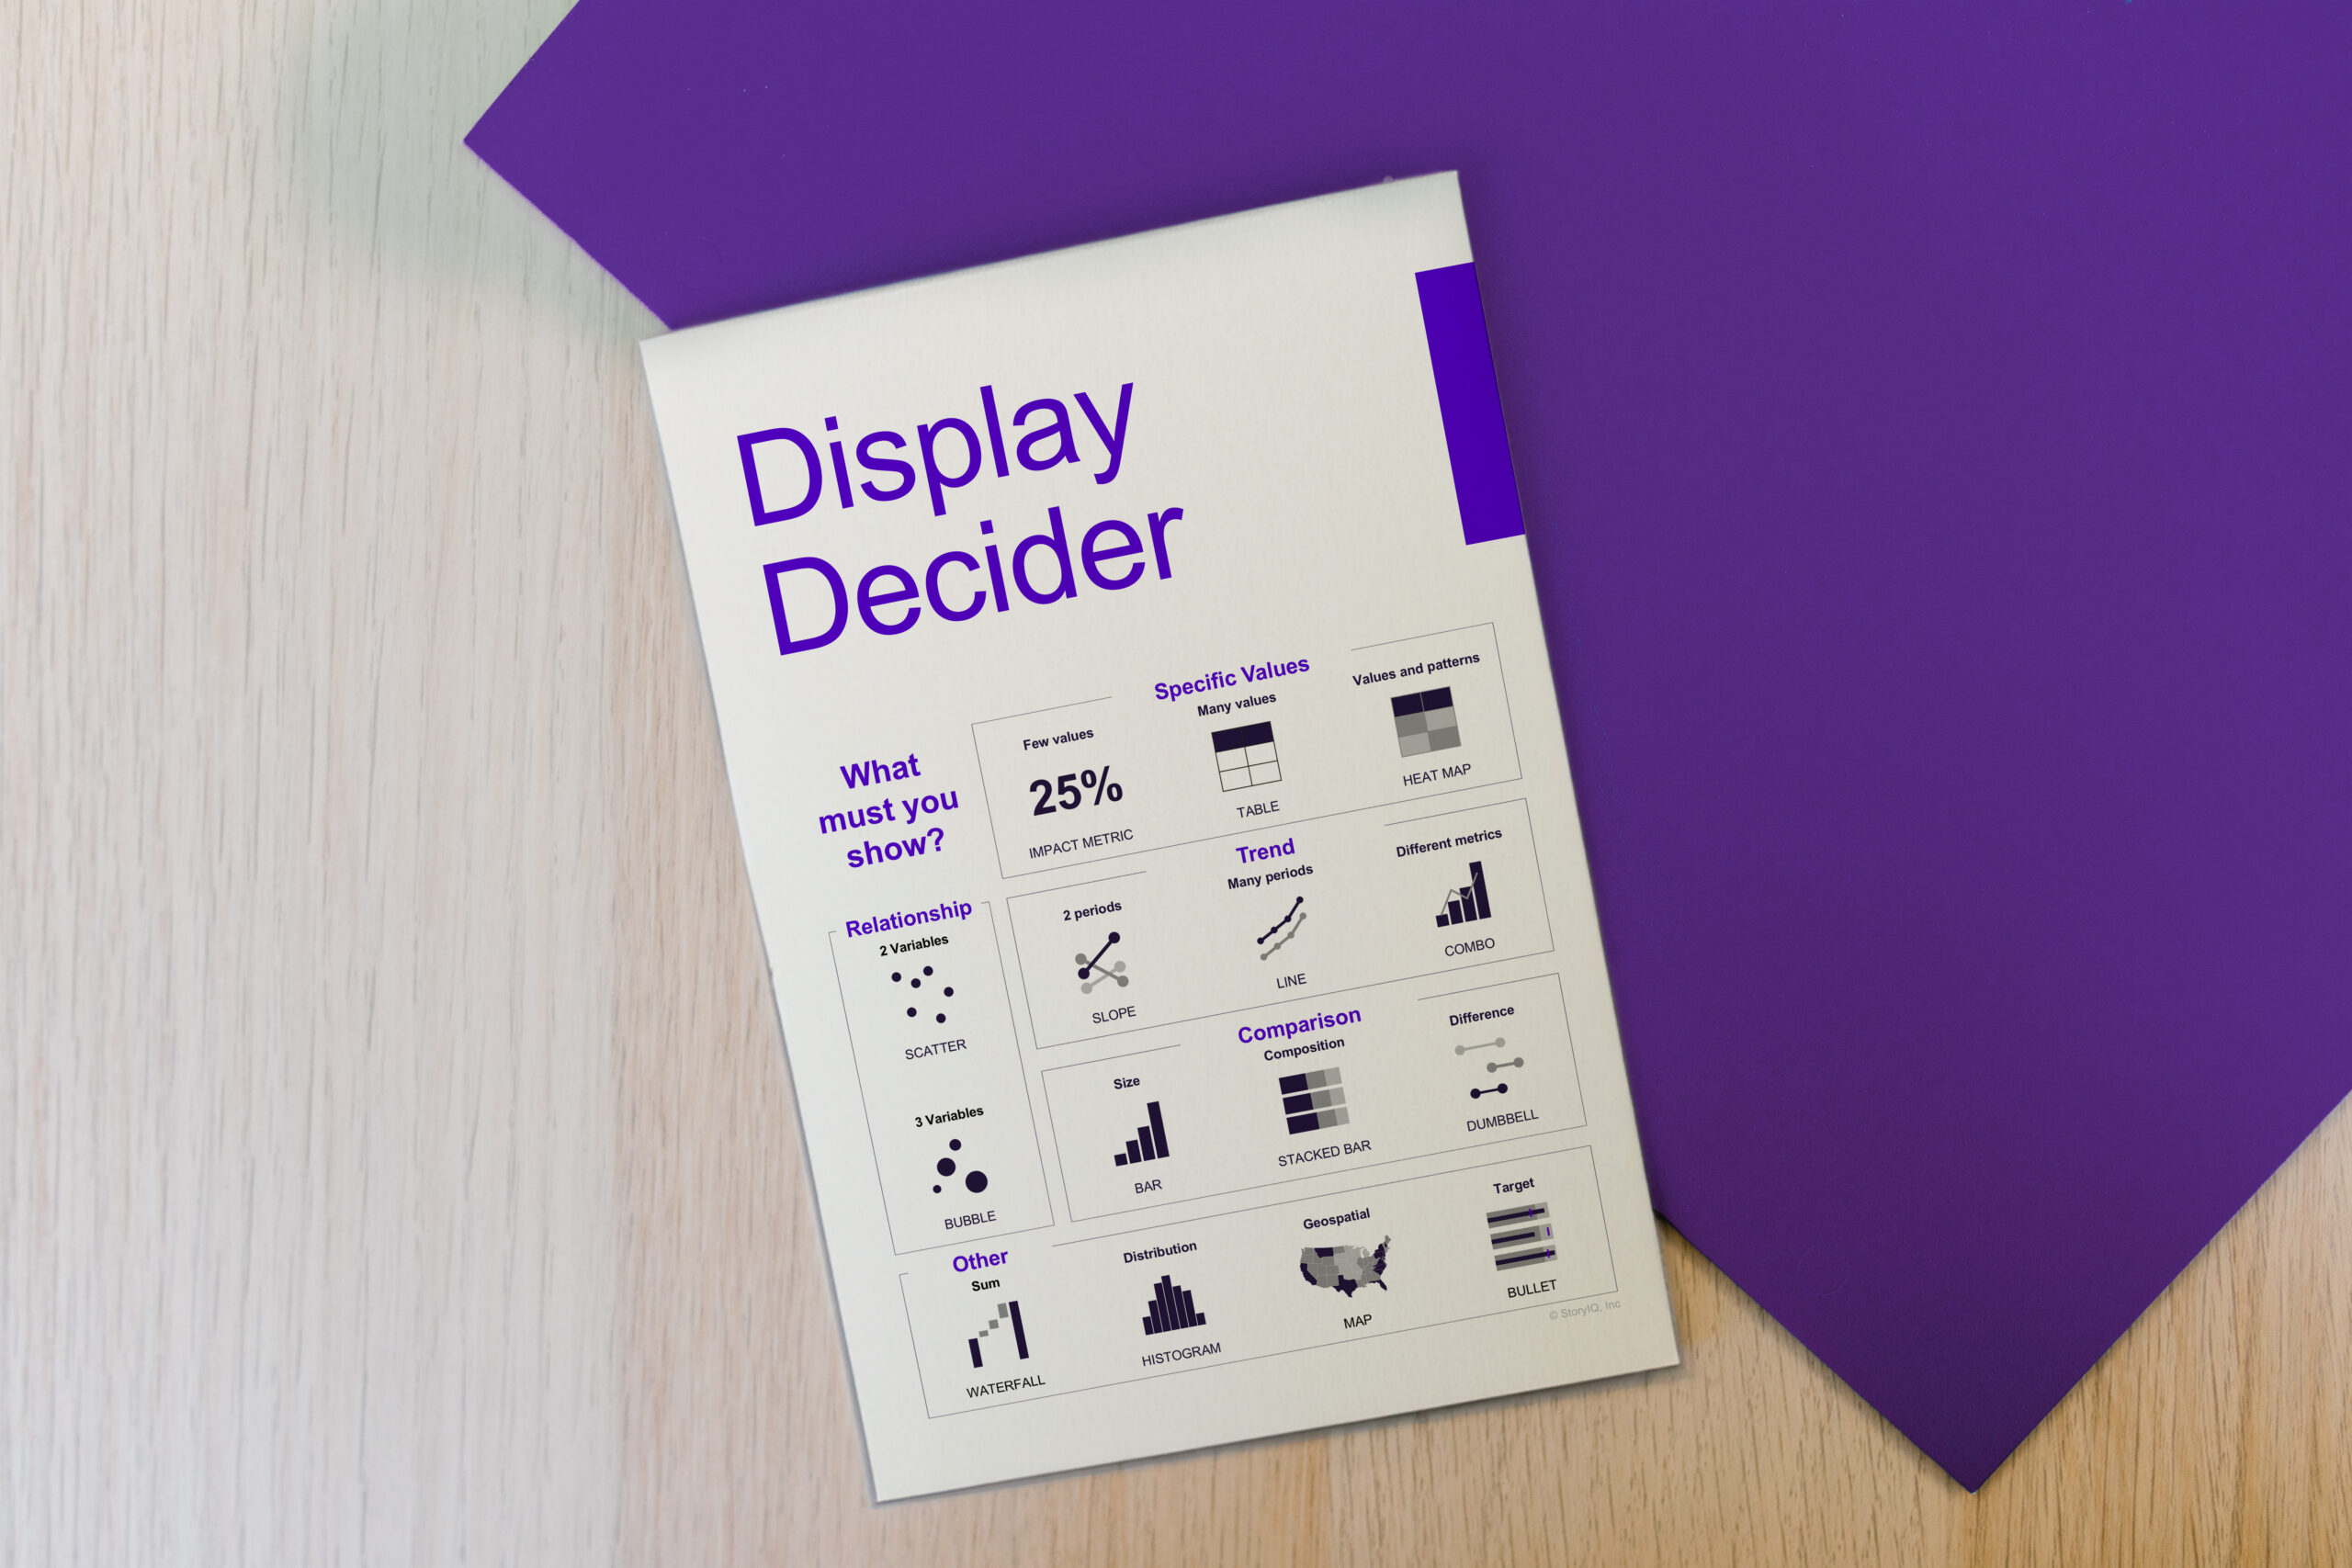
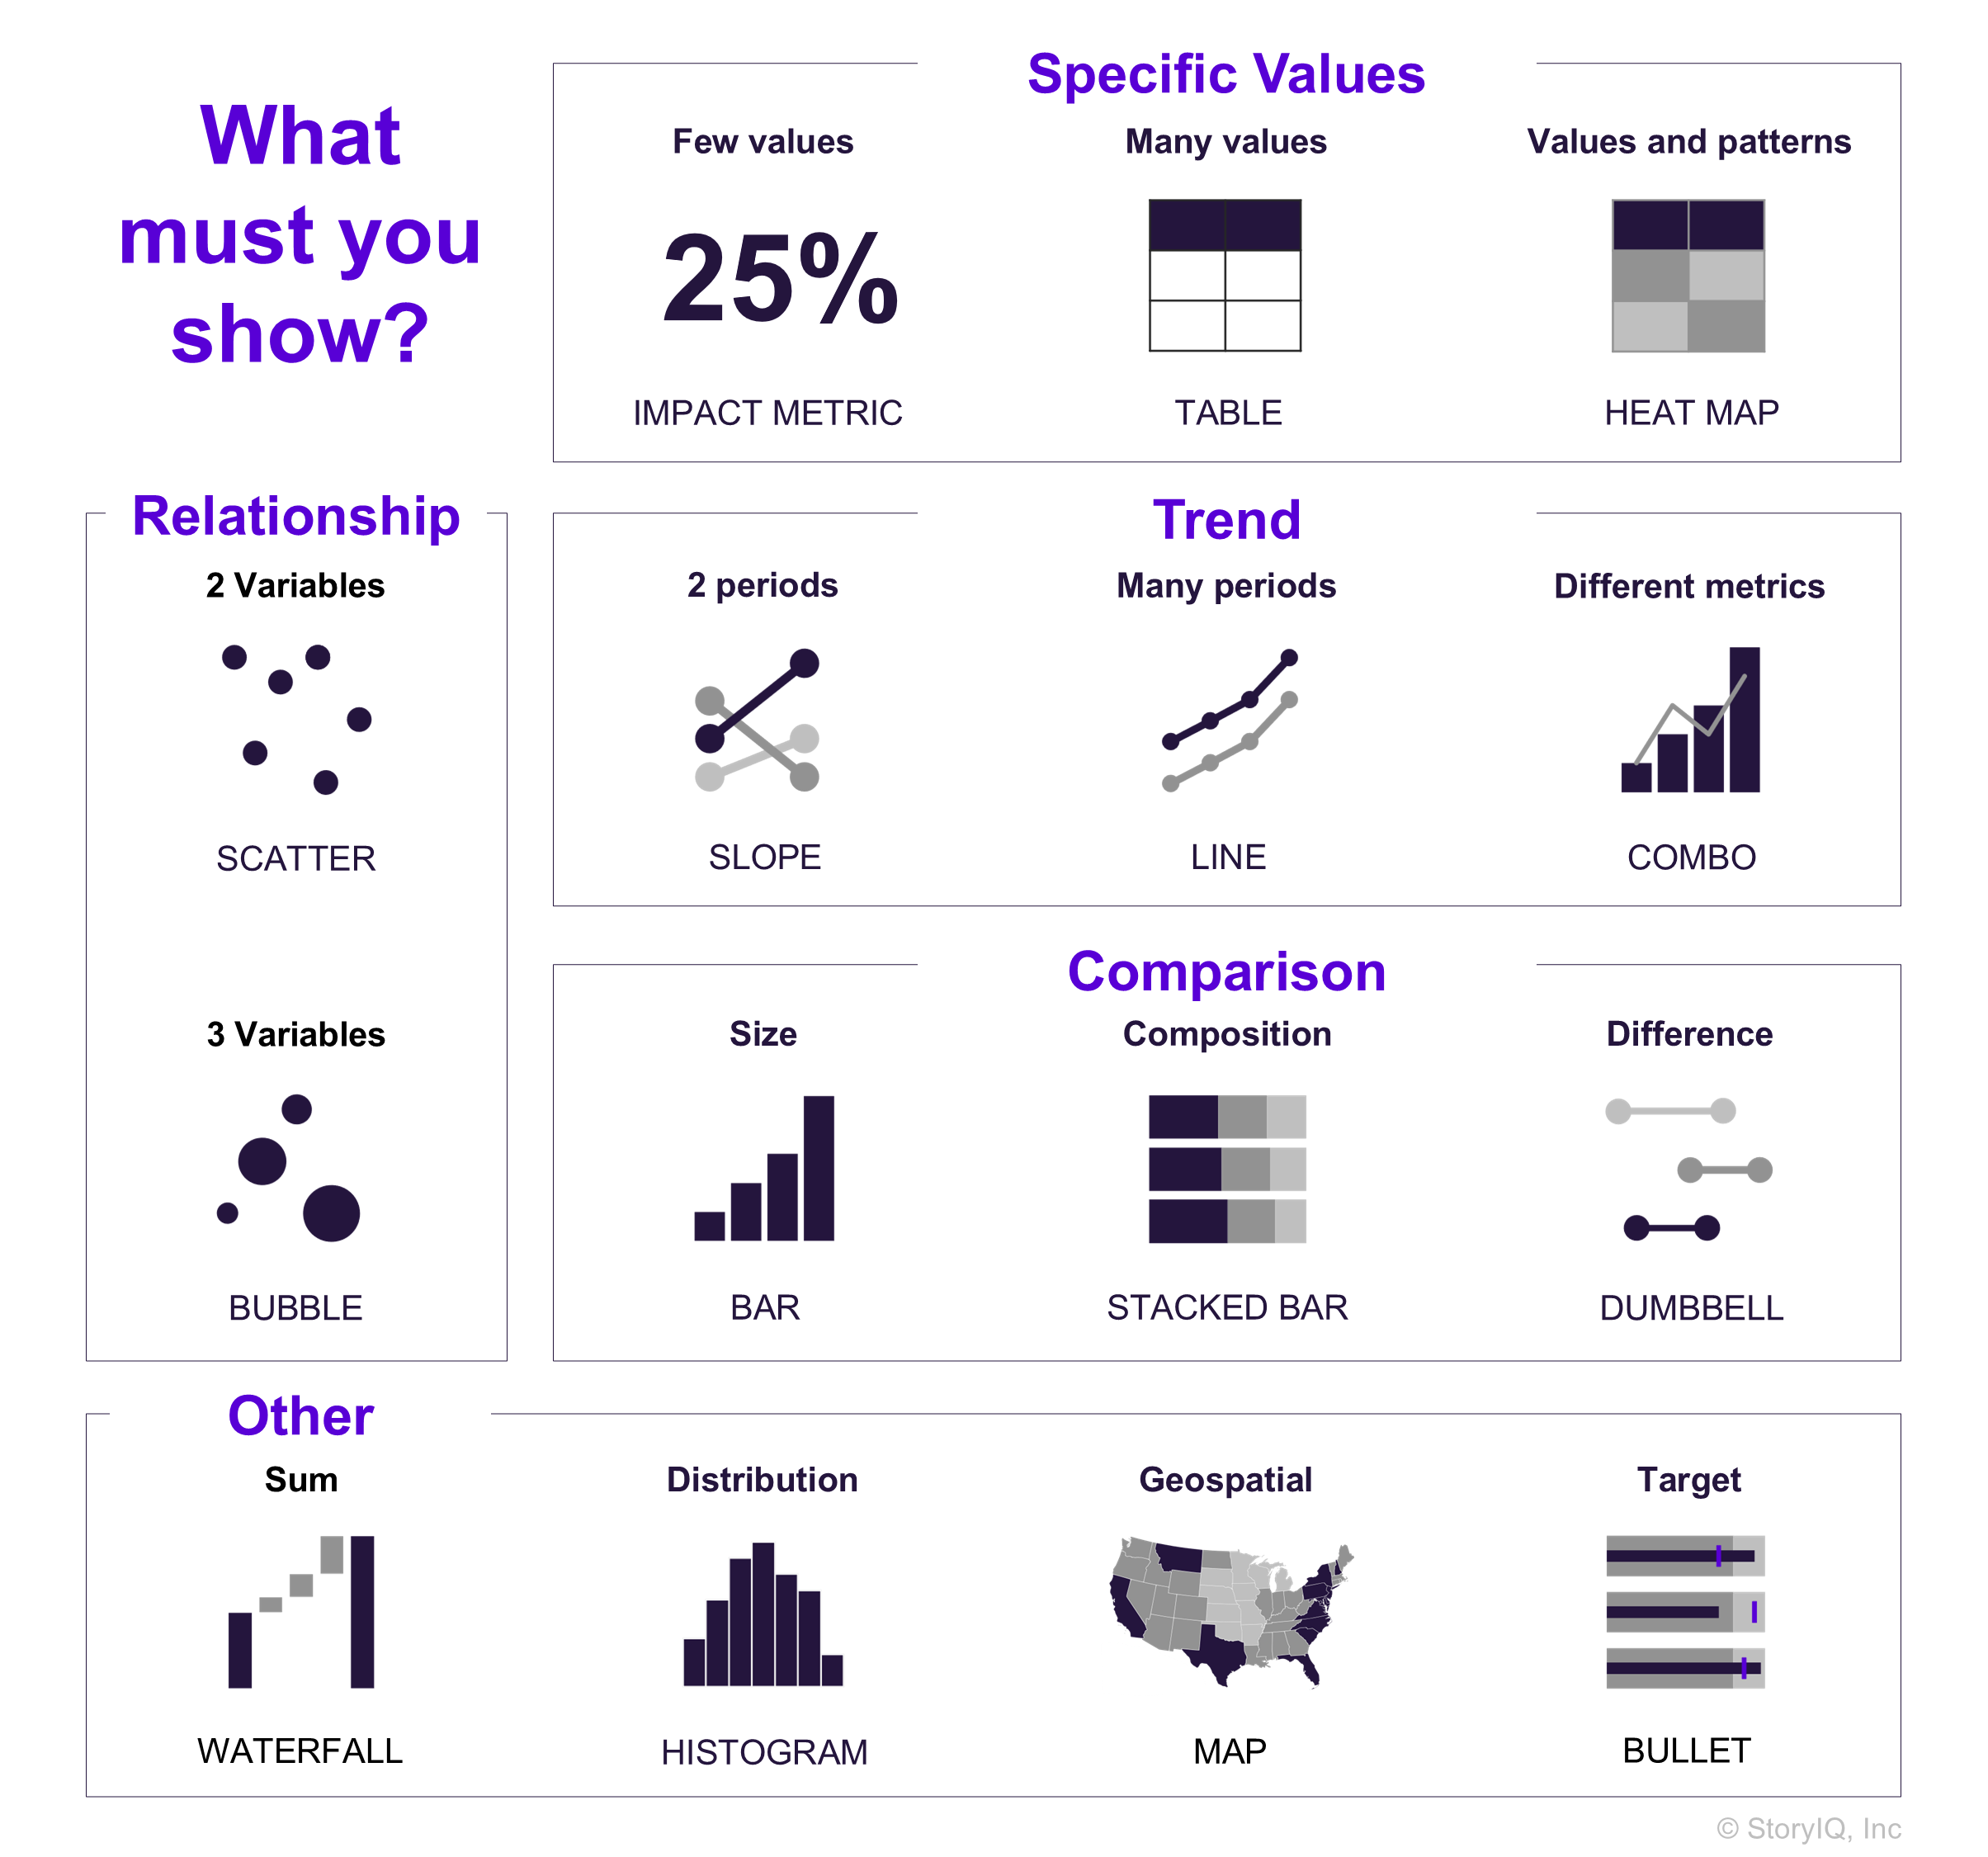
There isn't a single 'correct' chart to visualize a specific dataset. Let StoryIQ's Display Decider help you make chart selection easier.

There is no easy answer. We acknowledge that visualizing data is a creative process – there isn’t a single ‘correct’ chart that is the only solution for a specific set of data. And this can make chart selection daunting for data storytelling beginners. We’ve put together our ‘Display Decider’ as a thought starter for making chart selection easier. Disagree? Put your commentary on our LinkedIn post here .
Download PDF (high-res)


To learn more about data storytelling and other learning opportunities related to data communication, check out our scheduled workshops or contact us to set up a special class.

Learn with us and earn your certificate. See you at our next workshop!

Similar posts

Sharpen Your Insights: Choose the Right Metrics

Featuring the right metrics can set a good insight. Discover how to extract and visualize meaningful insights from raw data.

Revamp Your Charts with the ESCape Method

You don’t need fancy charts to improve how you visualize data. Let’s simplicity shine through the ESCape method.

What is Data Storytelling?

Grasp the key components of a data story and begin presenting data using narratives and visuals tailored to the audience's needs.

Sign up to hear about our upcoming courses and events: